What is the Turning Point Test?
Proposed by Irénée-Jules Bienaymé in 1874, this test is still an important part of the statistical toolbox. In scientific applications, it is most commonly used to find if a set of time-series data is truly random.
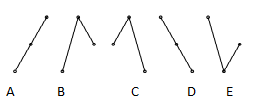
An Intuitive Understanding of the Turning Point Test
To understand the idea behind this test consider a set of three points. If the middle point is either above or below the other two there is a turning point. A set of observation data where every observation is a little greater than the next would have no turning points whatsoever. Such a set would fail the turning point test for randomness.
If you have a random series n periods long, you can expect the number of turning points to be approximately:![]()
The variance in the number of turning points would be:
![]() .
.
As the number of data points increases, the distribution of the number of turning points approaches normality quickly. For a series of n points, there should be around
(2/3)(n − 2)
turning points. As n grows larger, you should have about
N(2n/3, 8n/45)
points.
At the 5% alpha level, you can reject the null hypothesis that the series is random if the number of points lies outside of the range
2n/3 ± 1.96 √8n/45.
What this means is that a look at the number of turning points is a very effective way to flag non random data. The turning point test is an especially good test to uncover cyclicality. It is not quite so useful in ruling out general trends.
The Turning Point Test Statistic
To apply the turning point test to a set of data, where n > 15, let your null hypothesis be that they are independently, identically distributed random variables. Then you can calculate the value of
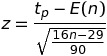
This test statistic has a normal distribution.
References
Nielsen, A. (2019). Practical Time Series Analysis: Prediction with Statistics and Machine Learning 1st Edition. O’Reilly Media.
Stoffer, D. (2017). Time Series Analysis and Its Applications: With R Examples 4th ed. Springer.
University of Cambridge. Time Series.