What is a Spectral Plot?
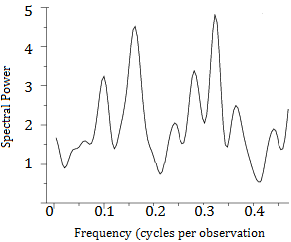
 A spectral plot is a graph which allows us to examine the cyclic structure, in the frequency domain, of a time series. A time series represents a progression of some parameter in time. We can think of it as a function of time, but it is typically random; We can’t predict exactly what it will do in the future; only what it might do.
In technical terms, a spectral plot is a smoothed Fourier transform of the auto-covariance function of the time series. But you don’t need to understand that sentence to understand how to read and use spectral plots.
In a spectral plot:
- The horizontal axis is the frequency—recorded in cycles per observation, which is the same as cycles per unit time when time is defined as the distance between points.
- The vertical axis is smoothed variance. This is computed from the data by a series of rather complicated computations which are typically left to a computer.
Importance of Spectral Plots
Spectral plots are important because they are the prime technique used in statistics and data analysis for determining the cyclic nature of univariate (one-variable) time series in the frequency domain. In typical frequency domain analysis, a run chart is first generated, followed by a spectral plot.
The spectral plot answers such questions as:
- Whether or not there is a dominant cyclic frequency,
- What that cyclic frequency might be,
- How many cyclic components there are.
Most general statistical software packages have the ability to compute and graph spectral plot; Since the computation is involved they are now rarely figured out by hand.
References
NIST/SEMATECH e-Handbook of Statistical Methods, 1.3.3.27. Spectral Plot. retrieved from https://www.itl.nist.gov/div898/handbook/eda/section3/spectrum.htm on April 5, 2018
Donman, Kenneth. Spectral Analysis: A Summary of the Theory and Techniques
retrieved from http://www.dfo-mpo.gc.ca/Library/14950.pdf on April 5, 2018