What is a Tolerance Level?
The term “tolerance level” has a few different meanings, depending on the context of where the term is being used:
- Setting Limits
- As a Measure of Error
- Measuring Collineariy
1. Setting Limits
In general use, tolerance level is used to set an upper limit of how much of something can be tolerated. For example:
- In environmental science, tolerance levels can refer to the upper and lower limits for a range of factors a particular species can tolerate (e.g. light, temperature, water).
- The FDA sets upper limits of chemicals and pollutants allowed in food. For example, mercury in fish has an upper limit of 1.0 mg/kg (Luten et al. 1990).
2. As a Measure of Error
The word tolerance level crops up in various scenarios as a measure of error. For example:
- Slovin’s formula uses an error tolerance, e, which is basically the same thing as a significance level. For example, if you wanted to be 98 percent confident that your data was going to be reflective of the entire population then e is calculated as follows: e = 1 – 0.98 = 0.02.
- Faherty (2007) notes that engineers and building contractors may use tolerance levels to refer to the “…amount of error or imprecision [engineers] will accept in their physical projects.” These values must be kept very low in order to avoid serious issues with structures. Used in this way, the term is loosely related to alpha levels in statistics.
- In Vital Statistics of the United States (Section 7—Technical Appendix—Page 15), the term is used in reference to medical coding errors on death certificates:
“…the area had to achieve a specified error tolerance level of less than 5 percent for coding all medical items for 3 consecutive months…”
3. As a Measure of Collinearity
“Tolerance” is used in regression analysis; you might sometimes see it reported in output. It’s a useful tool for diagnosing multicollinearity, which happens when variables are too closely related.
These reported tolerance levels are sometimes called the tolerance statistics.
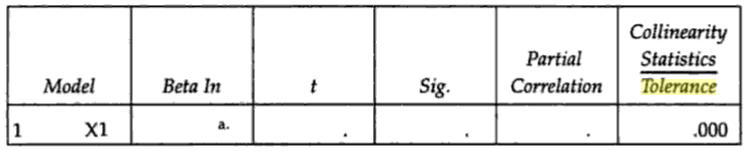
Tolerance is associated with each independent variable and ranges from 0 to 1. Allison (1999) notes that there isn’t a strict cut off for tolerance, but suggests a tolerance of below .40 is cause for concern. Weisburd & Britt state that anything under .20 suggests serious multicollinearity in a model.
- High tolerance (e.g. .84) = low multicollinearity
- Low tolerance (e.g. .19) = high (serious) multicollinearity
It is calculated as follows:
- Regress each independent variable on all of the other independent variables.
- Subtract each R2 value from 1.
References
Allison, P. (1999). Multiple Regression: A Primer. Pine Forge Press.
Faherty, V. (2007). Compassionate Statistics: Applied Quantitative Analysis for Social Services. Sage.
Weisburd, D. & Britt, C. (2013). Statistics in Criminal Justice. Springer Science & Business Media.
United States Bureau of the Census (1982). Vital Statistics of the United States.