Quartic regression fits a quartic function (a polynomial function with degree 4) to a set of data. Quartic functions have the form:
f(x) = ax4 + bx3 + cx2 + dx + e.
For example:
f(x) = -.1072x4 + 13.2x3 – 380.1x2 – 154.2x + 998
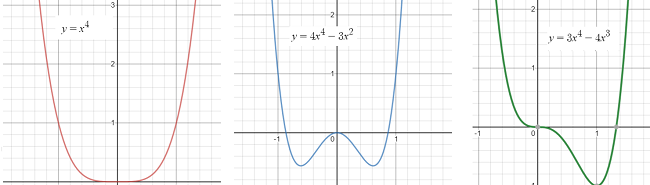
The quartic function takes on a variety of shapes, with different inflection points (places where the function changes shape) and zero to many roots (places where the graph crosses the axis). For a > 0, three basic shapes are formed (graphed with Desmos.com):
Why Use Quartic Regression?
Quartic regression is another option for finding a line of best fit for data; It fits just as well as a cubic regression function and may even provide a better fit.
When modeling the data, the coefficient of determination (R2) will guide you when comparing different regression models (Aufmann & Nation, 2013). R-squared gives you the percentage variation in y explained by x-variables. The range is 0 to 1 (i.e. 0% to 100% of the variation in y can be explained by the x-variables). So when comparing models, the model with the higher R2 is the “better” model because it explains more variation in the model.
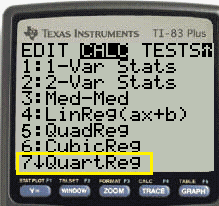
How to Perform Quartic Regression on the TI 83
On the TI-83, follow the instructions for quadratic regression in the TI83 / TI89. The steps are exactly the same, except you choose #7 from the menu, instead of #5.
Note though, that you need at least five data points to fit a model to a quartic function.
References
Aufmann, R. & Nation, R. Algebra & Trigonometry. Cengage Learning.
Hungerford, T. & Shaw, D. (2008). Contemporary Precalculus: A Graphing Approach. Cengage Learning.