Regression Analysis > Quadratic Regression
Contents (Click to skip to that section):
- What is Quadratic Regression?
- The Quadratic Equation
- R-Squared
- Find the Equation with a Calculator
- Find by Hand
What is Quadratic Regression?
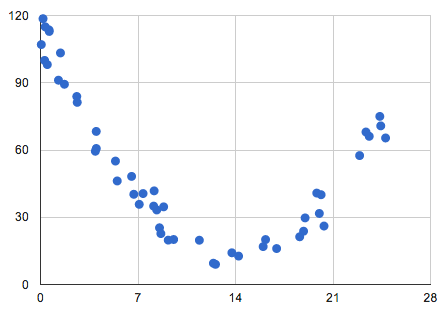
Quadratic regression is finding the best fit equation for a set of data shaped like a parabola.
The first step in regression is to make a scatter plot. If your scatter plot is in a “U” shape, either concave up (like the letter U) or concave down (∩), you’re probably looking at some type of quadratic equation as the best fit for your data. A quadratic doesn’t have to be a full “U” shape; you can have part of a it (say, a quarter or 3/4).
Quadratic regression is an extension of simple linear regression. While linear regression can be performed with as few as two points (i.e. enough points to draw a straight line), quadratic regression come with the disadvantage that it requires more data points to be certain your data falls into the “U” shape. It can technically be performed with three data points that fit a “V” shape, but more points are desirable. As more data points are required, it’s also more costly than simple linear regression (Leeuwen, 2010).
Quadratic Regression Equation
Quadratic regression is a way to model a relationship between two sets of variables. The result is a regression equation that can be used to make predictions about the data. The equation has the form:
y = ax2 + bx + c,
where a ≠ 0.
What is R-Squared in a Quadratic Regression?
R Squared (the coefficient of determination or R2), tells you how much variation in y is explained by x-variables. The range is 0 to 1, where 0 is 0% variation and 1 is 100% variation. It is used to analyze how differences in one variable can be explained by a difference in a second variable. For example, when a woman gets pregnant has a direct relation to when they give birth, so R-squared would be close to 100%. On the other hand, R-squared would be practically zero for when a woman gets pregnant and when she throws a retirement party for a parent.
Find the Equation with a Calculator
Contents:
TI-83 Instructions
Step 1: Press STAT, then press ENTER to enter the lists screen. If you already have data in L1 or L2, clear the data: move the cursor onto L1, press CLEAR and then ENTER. Repeat for L2.
Step 2: Enter your x-variables, one at a time into the L1 column. Press the ENTER key after each entry.
Step 3: Use the arrow keys to scroll across to L2 (the next column to the right).
Step 4: Enter your y-variables, one at a time. Press ENTER after each number.
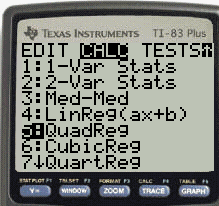
Step 5: Press the STAT button, then use the scroll key to highlight “CALC.”
Step 6: Arrow right to calc and then arrow down to QuadReg. Press ENTER.
Step 7: Type in the following parameters: L1, L2, Y1. Here’s the steps to do that:
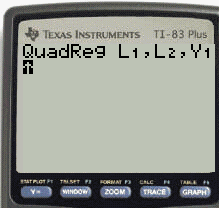
- Press [2nd] and then 1.
- Press the comma key.
- Press [2nd] and then 2.
- Press the comma key.
- Press VARS, right arrow to Y-VARS and press ENTER.
- Choose Y1 and press ENTER.
Step 8: Press ENTER to calculate the regression.
Tip: Press GRAPH to graph the parabola. From there, you can determine if the equation is a good fit for the data.
TI-89 Instructions
Sample Problem: Perform a quadratic regression TI 89 for the following data set:
x: 1, 2, 3, 4, 5, 6, 7, 8, 9
y: 32.5, 35.9, 37.3, 37.9, 36.4, 32.7, 32.4, 29.5, 28.5
Step 1: Press APPS and then use the cursor keys to scroll to the Data/Matrix Editor. Press ENTER.
Step 2: Select 1 for “Current.”
Step 3: Type your x-values into the c1 list and then type your y-values into the c2 list.
Step 4: Press F5 for Calc. A new screen will appear.
Step 5: Type your x-values into column c1 and your y-values into column c2.
Step 6: Move your cursor to the Calculation Type box, press the right-cursor key and select “9:QuadRegReg.”
Step 7: Type the location of your x-data into the “x” box. For example, if your x-values are in list c1 then type “c1.”
Step 8: Type the location of your y-data into the “y” box. For example, if your y-values are in list c2 then type “c2.”
Step 9: Move the cursor to the Store ReqEQ line and then press the right cursor key. Move the cursor to y1(x) and then press ENTER. A window will pop up with the data for the quadratic regression equation y=abx. The trigonometric regression equation will also appear in the y1= line of the Y= screen.
This particular quadratic regression equation is .34632 * x2 + 2.62653 * x + 31.51190.
Find by Hand
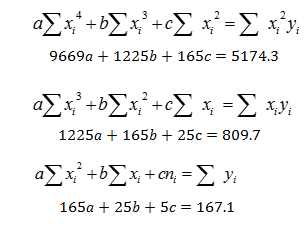
In order to find the quadratic regression by hand, you have to solve the following system of equations:
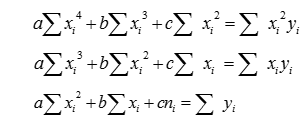
This set of equations is sometimes called normal equations. If you are not familiar with the summation sign (Σ), the steps below should make it clear, but if you’re still unsure you may want to read this summation notation article for more explanation.
Sample question:
Find the quadratic equation for the following set of data (this is every other data point from the sample calculator problem above, so the solution should be very close to .34632 * x2 + 2.62653 * x + 31.51190):
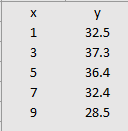
x: 1, 3, 5, 7, 9
y: 32.5, 37.3, 36.4, 32.4, 28.5
Step 1: Make a table (I used Excel so that the calculations would be easier). Input your x-values in the first column and your y-values in the second column:
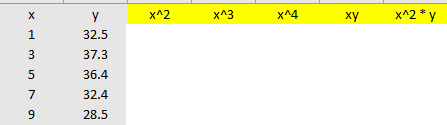
Step 2: Add 5 more columns labeled x2, x3, x4 xy, and x2y:
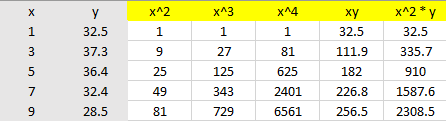
Step 3: Calculate each column. For example, the x2 column is simply the squares of the first column; the last column is the third column multiplied by the second column (the y-values):
Step 4: Sum the columns. As you might be able to tell, this is where Excel really helps out with the calculations:
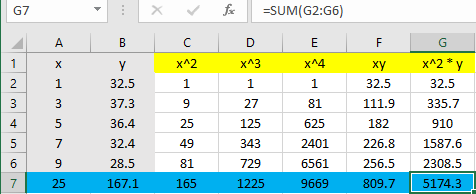
Step 5: Use the blue row (the summations) to fill in the blanks. All you’re doing is transferring the numbers to the normal equation (n is the number of items in the set, which is 5 in our example):
Step 6: Solve the system of equations. I used this online calculator:
a = -0.3660714
b = 3.015714
c = 30.42179
Step 7: Insert the values from Step 6 into the quadratic equation (I’m rounding to 3 decimal places):
y = ax2 + bx + c
y = -0.366x2 + 3.016x + 30.422
As we expected, that’s very close to the TI-89 solution for all 9 points
(.346x2 + 2.627 x + 31.511)
That’s it!
References
Leeuwen, J. et al. (2010). SOFSEM 2010: Theory and Practice of Computer Science: 36th Conference on Current Trends in Theory and Practice of Computer Science, Špindleruv Mlýn, Czech Republic, January 23-29, 2010. Proceedings