Statistics Definitions > Non Centrality Parameter (NCP)
What is the Non Centrality Parameter (NCP)?
The non centrality parameter (λ) is a measure of “…the degree to which a null hypothesis is false” (Kirk, 2012). In other words, it tells you something about the statistical power of a test.

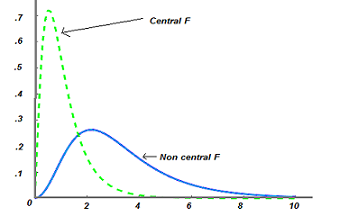
For example, an F-distribution with an NCP parameter of zero means that the F-distribution is a central F-distribution. As the Non Centrality Parameter increases, the shape of the F-distribution shifts to the right. This also means that a larger percentage of the curve moves to the right of the critical value for alpha. The result is an increase in statistical power.
The F-distribution, Chi-square distribution, Student T-distribution, and Beta distribution have central distributions, which all occur when the NCP is set to zero. The central distribution can be viewed as a special case (λ = 0) from the set of all possible non central distributions.
Formula for F-Distribution NCP
The formula for the NCP is related to the F ratio:
F = (σe2 + σΒ2 / σe2). When the variance of the group means in the numerator increases, the F ratio gets larger and the F distribution stretches to the right.
As a formula, the NCP is the ratio of the ANOVA sum of square between to mean square within (Carlberg, 2004; Kirk, 2012):

Where:
- j indexes the groups,
- n is the number of observations per group,
- &Beta is the grand mean – a group mean.
Disambiguation
Some authors describe the Non Centrality Parameter as the degree of misspecification of a model. Others define it as a control for the shape of a distribution. Sometimes the NCP is simply defined as a “Difference in means.” One thing is clear: The term “Non Centrality Parameter” has been defined inconsistently across texts for years (Carlberg, 2014). The exact definition of the NCP depends largely on where you are reading it.
Jondeau et. al (2007) describe the NCP as a parameter that “controls the shape of the [T-distribution].”

Even the notation is up for debate: φ, δ, d, or λ? Roncoroni et. al. use the following formula for the NCP:

The recent majority seem to be in agreement that the accepted notation is λ (Carlberg, 2004). After some pretty hefty reading, I decided to skew this article towards the more commonly accepted definition of λ as it relates to the F Distribution and statistical power. There are other interpretations, so you might find the following notes useful:
- φ has been used for decades to look up statistical power in charts (Carlberg suggests the September 1957 Journal of the American Statistical Association for an example of how φ is used). It is not the same as the NCP.
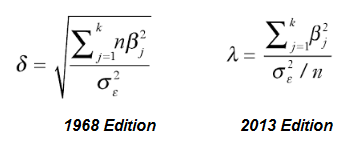
- δ is used by some fairly modern texts (like this one from 2007) and it has also been used by many prominent texts — some with the incorrect formula as well. Carlberg notes a “prominent older text” which changes over the years to not only use λ instead of δ, but loses a square root symbol as well:

.
References:
Carlberg, C. (2014). Statistical Analysis: Microsoft Excel 2013. Pearson Education.
Kirk, R. (2012). Experimental Design: Procedures for Behavioral Sciences. SAGE Publications.
Roncoroni A, et. al. (2015). Handbook of Multi-Commodity Markets and Products: Structuring, Trading and Risk Management. John Wiley & Sons.
