Contents:
- What is a Mapping Diagram?
- How to Draw Mapping Diagrams for Functions
- Mapping Diagrams Relationships
What is a Mapping Diagram for Functions?
A mapping diagram for functions (sometimes called transformation figure or arrow diagram) has two shapes, parallel axes, or number lines representing the domain (e.g. x-values) and range (e.g. y-values). These diagrams show the relationship between the points; In other words, it shows what comes out of a function for a variety of inputs.
Types of Mapping Diagram for Functions
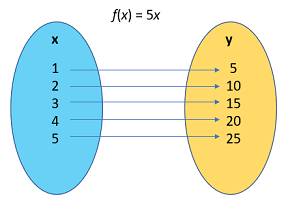
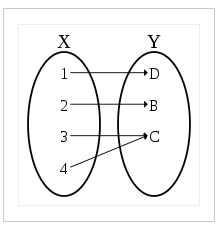
The most common type of mapping diagram has two shapes (these can be ovals, rectangles, or any other shape). The left-hand shape has the x-values (or other inputs) and the right-hand oval has the y-values (or other outputs). Arrows point from a specific x-value to that value’s transformation into a y-value:
Another common mapping diagram shows the same data, but without the shapes. Parallel number lines are used to plot the points. The following diagram shows same data from above, plotted on two vertical number lines:
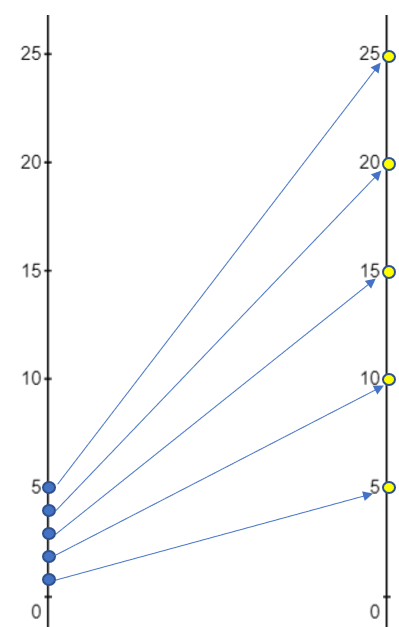
Both of the above mapping diagrams show the relation R, where R just means that x and y are related in some way. The information in the above diagrams can be rewritten as a set of ordered pairs—the relation:
{(1, 5), (2, 10), (3, 15), (4, 20), (5, 25)},
where the domain is the set {1, 2, 3, 4, 5} and the range is the set {5, 10, 15, 20, 25} [1].
How to Draw a Mapping Diagrams for Functions
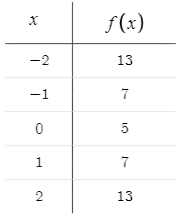
Example question: Draw a mapping diagram for the function f(x) = 2x2 + 5 in the set of real numbers.
Step 1: Create a table of values. If you aren’t given a set of inputs, pick a few values around zero. For this example, we’ll use (-2, -1, 0, 1, 2).
You can create a table of values on the TI-89 or by evaluating the function by hand. For this table, I used the function calculator at Desmos:
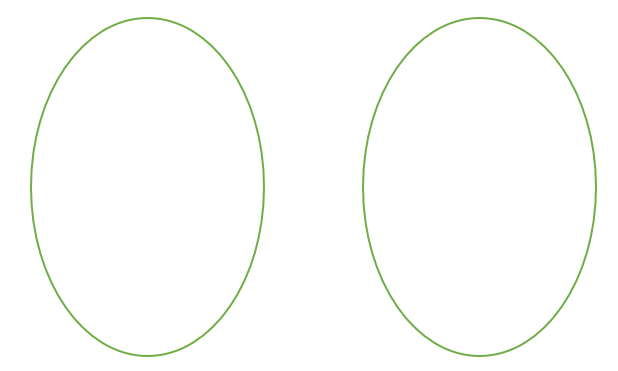
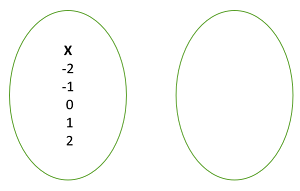
Step 2: Draw two ovals:
Step 3: Place the ordered x-values in the left oval:
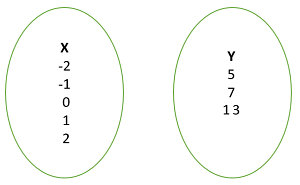
Step 4: Place the ordered y-values in the right oval: Make sure the numbers are ordered with no duplicates:
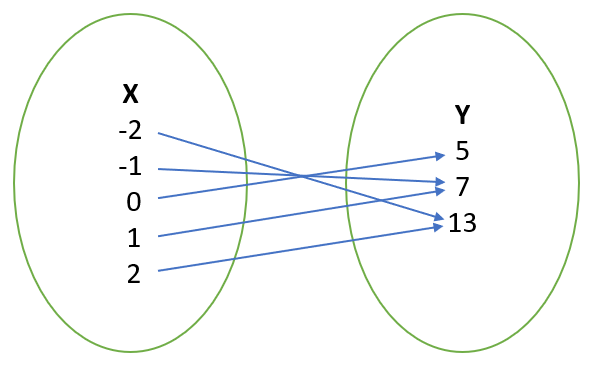
Step 5: Connect the pairs with arrows: Go through your table, starting in the top row, and draw one arrow for each ordered pair:
Mapping Diagrams Relationships
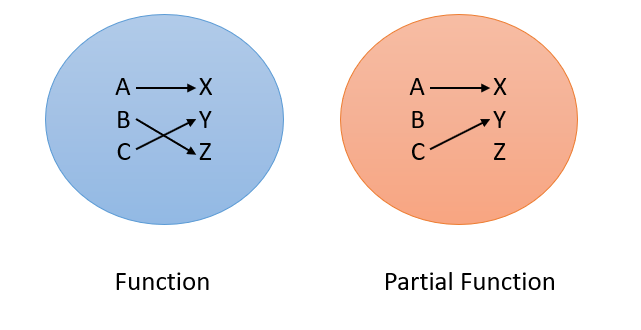
Mapping diagrams can show a variety of different relationships. For example:
One to one functions, where each input has a unique output and partial functions, where some “links” are missing:
Many to one functions, where different inputs give the same output:
References
[1] Relations and Functions. Retrieved April 28, 2021 from: https://faculty.atu.edu/mfinan/2033/section7.pdf
Kirby, D. & McClure, L. (2004). Maths Connect. Heinemann Educational Publishers,