What is Kernel Density Estimation?
Kernel density estimation extrapolates data to an estimated population probability density function. It’s called kernel density estimation because each data point is replaced with a kernel—a weighting function to estimate the pdf. The function spreads the influence of any point around a narrow region surrounding the point.
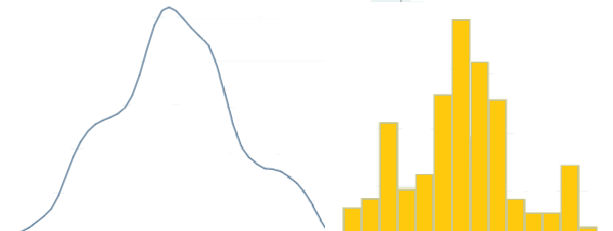
The resulting probability density function is a summation of every kernel. In many ways, it’s just like the familiar histogram; tracing the outline of a histogram gives you a rough estimate because the area under a histogram represents 100% of the distribution (Pruim, 2011). The primary difference between the histograms and kernel densities is that in histograms, you state the number of divisions (or “bins”); On the other hand, you state a width for kernel densities (Stata).
Kernel Density Estimate Uses
Kernel estimations are many times thought to be a wiser choice than cumulative probability distributions for showing multiple peaks (multimodality) (Hart et al.).
Kernels are also very useful if you’re dealing with specific density estimations. In some cases, densities might be nearly impossible to calculate without kernels. For example, some types of circular data can best be modeled with a von Mises density kernel, which has two important properties: the kernel is symmetric, and it decreases the further away from the kernel’s central point (Pewsky et al. 2013). Other common types include:
| Kernel Type | Support | Formula |
| Cosine | |μ| ≤1 | 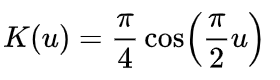 |
| Gaussian | All | 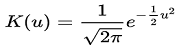 |
| Epanechnikov (Parabolic) | μ ≤ 1 | 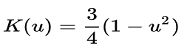 |
| Quartic (biweight) | μ ≤ 1 | 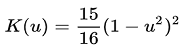 |
| Triangle | μ ≤ 1 | 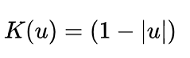 |
| Tricube | μ ≤ 1 | 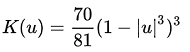 |
| Triweight | μ ≤ 1 | 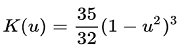 |
| Uniform | μ ≤ 1 |  |
References
Dodge, Y. (2008). The Concise Encyclopedia of Statistics. Springer.
Hart, J. et al. Kernel Testing as an Alternative to χ2 Analysis for
Investigating the Distribution of Quantitative Traits. 2009. Retrieved June 15, 2020 from: http://www.stat.tamu.edu/~hart/compare.pdf
Pruim, R. Foundations and Applications of Statistics: An Introduction Using R. American Mathematical Society. 2011.
Stata. Kdensity.