Contents:
What is Cronbach’s Alpha?
Cronbach’s alpha, α (or coefficient alpha), developed by Lee Cronbach in 1951, measures reliability, or internal consistency. “Reliability” is another name for consistency.
Cronbach’s alpha tests to see if multiple-question Likert scale surveys are reliable. These questions measure latent variables—hidden or unobservable variables like: a person’s conscientiousness, neurosis or openness. These are very difficult to measure in real life. Cronbach’s alpha will tell you how closely related a set of test items are as a group.
Watch the video for an overview and formula calculation:

Can’t see the video? Click here to watch it on YouTube.
Cronbach’s Alpha Formula
The formula for Cronbach’s alpha is:
Where:
- N = the number of items.
- c̄ = average covariance between item-pairs.
- v̄ = average variance.
Cronbach’s Alpha in SPSS
While it’s good to know the formula behind the concept, in reality you won’t actually need to work it. You’ll often calculate alpha in SPSS or similar software.
To run Cronbach’s alpha in SPSS, make sure you’re measuring latent variables on the Likert scale. Cronbach’s alpha will tell you how closely related a set of test items are as a group.
The steps are:
Step 1: Click “Analyze,” then click “Scale” and then click “Reliability Analysis.”
Step 2: Transfer your variables (q1 to q5) into “Items,”. The model default should be set as “Alpha.”
Step 3: Click “Statistics” in the dialog box.
Step 4: Select “Item,” “Scale,” and “Scale if item deleted” in the box description. Choose “Correlation” in the inter-item box.
Step 5: Click “Continue” and then click “OK”.
Step 4 can be omitted, but this will allow you to analyze problems with individual test questions. Specifically, it might highlight one or more questions with low alpha values (I work through a specific example in the video).
Rule of Thumb for Results
A rule of thumb for interpreting alpha for dichotomous questions (i.e. questions with two possible answers) or Likert scale questions is:
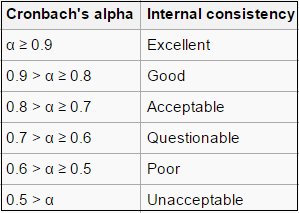
In general, a score of more than 0.7 is usually okay. However, some authors suggest higher values of 0.90 to 0.95.
Avoiding Issues with Cronbach’s Alpha
Use the rules of thumb listed above with caution. A high level for alpha may mean that the items in the test are highly correlated. However, α is also sensitive to the number of items in a test. A larger number of items can result in a larger α, and a smaller number of items in a smaller α. If alpha is high, this may mean redundant questions (i.e. they’re asking the same thing).
A low value for alpha may mean that there aren’t enough questions on the test. Adding more relevant items to the test can increase alpha. Poor interrelatedness between test questions can also cause low values, so can measuring more than one latent variable.
Confusion often surrounds the causes for high and low alpha scores. This can result in incorrectly discarded tests or tests wrongly labeled as untrustworthy. Psychometrics professor Mohsen Tavakol and medical education professor Reg Dennick suggest that improving your knowledge about internal consistency and unidimensionality will lead to the correct use of Cronbach’s alpha1:
Unidimensionality in Cronbach’s alpha assumes the questions are only measuring one latent variable or dimension. If you measure more than one dimension (either knowingly or unknowingly), the test result may be meaningless. You could break the test into parts, measuring a different latent variable or dimension with each part. If you aren’t sure about if your test is unidimensional or not, run Factor Analysis to identify the dimensions in your test.
References
Lavrakas, P. (2008). Encyclopedia of Survey Research Methods 1st Edition. SAGE.
Mohsen Tavakol and Reg Dennick. Making Sense of Cronbach’s Alpha. International Journal of Medical Education. 2011; 2:53-55 Editorial
Salkind, N. (2015). Encyclopedia of Measurement and Statistics 1st Edition. SAGE.