You may find it helpful to read the precious article first: What is Effect Size?
What is Cohen’s D?
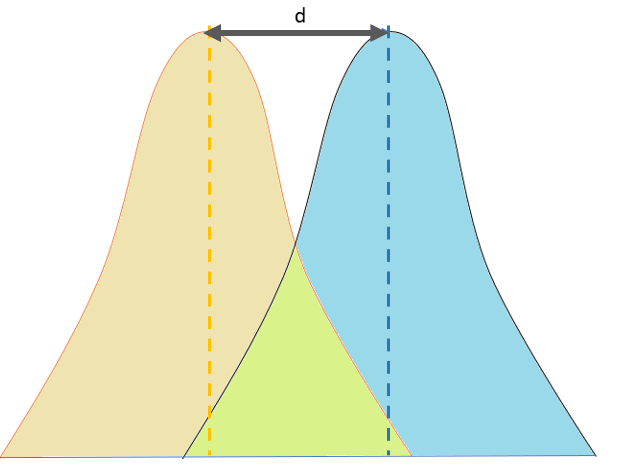
Cohen’s D , or standardized mean difference, is one of the most common ways to measure effect size. An effect size is how large an effect is. For example, medication A has a larger effect than medication B. While a p-value can tell you if there is an effect, it won’t tell you how large that effect is.
Cohen’s D specifically measures the effect size of the difference between two means.
Watch the video for an example of how to calculate Cohen’s D (includes formulas for small sample correction and unequal sizes):

Can’t see the video? Click here to watch it on YouTube.
Formula
The formula for Cohen’s D (for equally sized groups) is:
d = (M1 – M2) / spooled
Where:
- M1 = mean of group 1
- M2 = mean of group 2
- spooled = pooled standard deviations for the two groups. The formula is: √[(s12+ s22) / 2]
Cohen’s D works best for larger sample sizes (> 50). For smaller sample sizes, it tends to over-inflate results. A correction factor is available, which reduces effect sizes for small samples by a few percentage points:
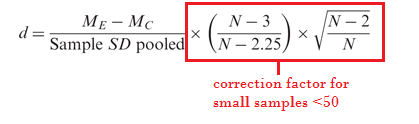
Note: The bias towards small samples bias is slightly smaller for an alternative method, Hedges’ g, which uses n-1 for each sample.
Interpreting Results
A d of 1 indicates the two groups differ by 1 standard deviation, a d of 2 indicates they differ by 2 standard deviations, and so on. Standard deviations are equivalent to z-scores (1 standard deviation = 1 z-score).
Rule of Thumb Interpretation
If you aren’t familiar with the meaning of standard deviations and z-scores, or have trouble visualizing what the result of Cohen’s D means, use these general “rule of thumb” guidelines (which Cohen said should be used cautiously):
- Small effect = 0.2
- Medium Effect = 0.5
- Large Effect = 0.8
“Small” effects are difficult to see with the naked eye. For example, Cohen reported that the height difference between 15-year-old and 16-year-old girls in the US is about this effect size. “Medium” is probably big enough to be discerned with the naked eye, while effects that are “large” can definitely be seen with the naked eye (Cohen calls this “grossly perceptible and therefore large”). For example, the difference in heights between 13-year-old and 18-year-old girls is 0.8. An effect under 0.2 can be considered trivial, even if your results are statistically significant.
Bear in mind that a “large” effect isn’t necessarily better than a “small” effect, especially in settings where small differences can have a major impact. For example, an increase in academic scores or health grades by an effect size of just 0.1 can be very significant in the real world. Durlak (2009) suggests referring to prior research in order to get an idea of where your findings fit into the bigger context.
Transforming Cohen’s D into other measures
To transform Cohen’s D into Hedge’s g, use the following equation:
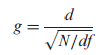
Where:
- N = sample size,
- df = degrees of freedom.
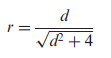
To transform Cohen’s d into the correlation coefficient, r, use this formula:
References
Agresti A. (1990) Categorical Data Analysis. John Wiley and Sons, New York.
Klein, G. (2013). The Cartoon Introduction to Statistics. Hill & Wamg.
Kotz, S.; et al., eds. (2006), Encyclopedia of Statistical Sciences, Wiley.
Vogt, W.P. (2005). Dictionary of Statistics & Methodology: A Nontechnical Guide for the Social Sciences. SAGE.