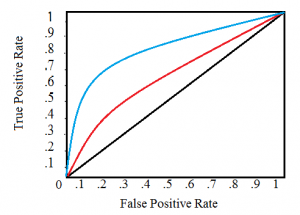
ROC Curve > C-Statistic
You may want to read this article first: What is a Receiver Operating Characteristic (ROC) curve?.
What is a C-Statistic?

- A value below 0.5 indicates a very poor model.
- A value of 0.5 means that the model is no better than predicting an outcome than random chance.
- Values over 0.7 indicate a good model.
- Values over 0.8 indicate a strong model.
- A value of 1 means that the model perfectly predicts those group members who will experience a certain outcome and those who will not.
The C-statistic isn’t used very often as it only gives you a general idea about a model; A ROC curve contains much more information about accuracy, sensitivity and specificity.
Weighting
A weighted c-index is used when the cost of failing to predict a positive outcome (like a test for cancer) is higher than benefit of correctly predicting a negative outcome. Weighting penalizes models that result in small probability differences for positive and negative outcomes, but doesn’t change the value of the C-statistic. It can also be used to adjust for stratified random sampling.
Statistical Significance
Like most statistics, the C-statistic is sometimes paired with a confidence interval. For example, you might have a result of 0.63 with a confidence interval ranging from 0.53 to 0.73). In general, any result is not significant if it includes 0.5, even if it includes the relevant C-statistic. For example, a result of 0.63 with a CI ranging from 0.43 to 0.83 would not be significant because it includes 0.5 in that range.
Reference:
Hosmer DW, Lemeshow S. Applied Logistic Regression (2nd Edition). New York, NY: John Wiley & Sons; 2000.