Logistic Regression > Hosmer-Lemeshow Test
You may find it helpful to read this article first: What is Logistic Regression?
What is the Hosmer-Lemeshow Test?
The Hosmer-Lemeshow test (HL test) is a goodness of fit test for logistic regression, especially for risk prediction models. A goodness of fit test tells you how well your data fits the model. Specifically, the HL test calculates if the observed event rates match the expected event rates in population subgroups.
The test is only used for binary response variables (a variable with two outcomes like alive or dead, yes or no).
Running The Test
Data is first regrouped by ordering the predicted probabilities and forming the number of groups, g.
The Hosmer-Lemeshow test statistic is calculated with the following formula (which is for the 10-group case—modify for your specific number of groups):
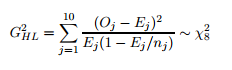
Where:
- Χ2 = chi squared.
- nj = number of observations in the jth group.
- Oj = number of observed cases in the jth group.
- Oj = number of expected cases in the jth group.
- Σ = summation notation. For the above formula, we’re summing from 1 to 10. Modify the summation for your number of groups.
This test is usually run using technology. The output returns a chi-square value (a Hosmer-Lemeshow chi-squared) and a p-value (e.g. Pr > ChiSq). Small p-values mean that the model is a poor fit.
Like most goodness of fit tests, these small p-values (usually under 5%) mean that your model is not a good fit. But large p-values don’t necessarily mean that your model is a good fit, just that there isn’t enough evidence to say it’s a poor fit. Many situations can cause large p-values, including poor test power. Low power is one of the reasons this test has been highly criticized.
Problems with the HL Test
Since its inception, several problems have been identified with the HL test. For example, it doesn’t take overfitting into account and tends to have low power. There is also very little guidance to selecting the number of subgroups. The number of subgroups, g, is usually calculated using the formula g> P + 1.
For example, if you had 12 covariates in your model, then g > 12. How much bigger than 12 g should be is essentially left up to you. Small values for g give the test less opportunity to find mis-specifications. Larger values mean that the number of items in each subgroup may be too small to find differences between observed and expected values. Sometimes changing g by very small amounts (e.g. by 1 or 2) can result in wild changes in p-values. As such, the selection for g is often confusing and, semimngly, arbitrary.
There are other problems, including arbitrary choices of bins. As such, the test is usually not recommended.
References
Hosmer, D. W., Jr., S. A. Lemeshow, and R. X. Sturdivant. 2013. Applied Logistic Regression. 3rd ed. Hoboken, NJ: Wiley.