What is Bivariate Data?
Data in statistics is sometimes classified according to how many variables are in a particular study. For example, “height” might be one variable and “weight” might be another variable. Depending on the number of variables being looked at, the data might be univariate, or it might be bivariate.
When you conduct a study that looks at a single variable, that study involves univariate data. For example, you might study a group of college students to find out their average SAT scores or you might study a group of diabetic patients to find their weights. Bivariate data is when you are studying two variables. For example, if you are studying a group of college students to find out their average SAT score and their age, you have two pieces of the puzzle to find (SAT score and age). Or if you want to find out the weights and heights of diabetic patients, then you also have bivariate data. Bivariate data could also be two sets of items that are dependent on each other. For example:
- Ice cream sales compared to the temperature that day.
- Traffic accidents along with the weather on a particular day.
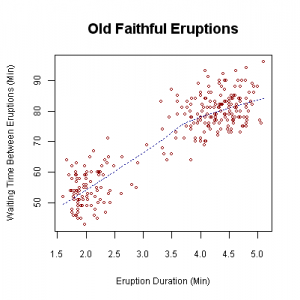
Bivariate data has many practical uses in real life. For example, it is pretty useful to be able to predict when a natural event might occur. One tool in the statistician’s toolbox is bivariate data analysis. Sometimes, something as simple as plotting one variable against another on a Cartesian plane can give you a clear picture of what the data is trying to tell you. For example, the scatterplot below shows the relationship between the time between eruptions at Old Faithful vs. the duration of the eruption.
Watch the video below for an overview on what bivariate data analysis is:
Can’t see the video? Click here to watch it on YouTube.
What is Bivariate Analysis?
Bivariate analysis means the analysis of bivariate data. It is one of the simplest forms of statistical analysis, used to find out if there is a relationship between two sets of values. It usually involves the variables X and Y.
- Univariate analysis is the analysis of one (“uni”) variable.
- Bivariate analysis is the analysis of exactly two variables.
- Multivariate analysis is the analysis of more than two variables.
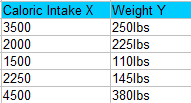
The results from bivariate analysis can be stored in a two-column data table. For example, you might want to find out the relationship between caloric intake and weight (of course, there is a pretty strong relationship between the two. You can read more here.). Caloric intake would be your independent variable, X and weight would be your dependent variable, Y.
Bivariate analysis is not the same as two sample data analysis. With two sample data analysis (like a two sample z test in Excel), the X and Y are not directly related. You can also have a different number of data values in each sample; with bivariate analysis, there is a Y value for each X. Let’s say you had a caloric intake of 3,000 calories per day and a weight of 300lbs. You would write that with the x-variable followed by the y-variable: (3000,300).
Two sample data analysis
Sample 1: 100,45,88,99
Sample 2: 44,33,101
Bivariate analysis
(X,Y)=(100,56),(23,84),(398,63),(56,42)
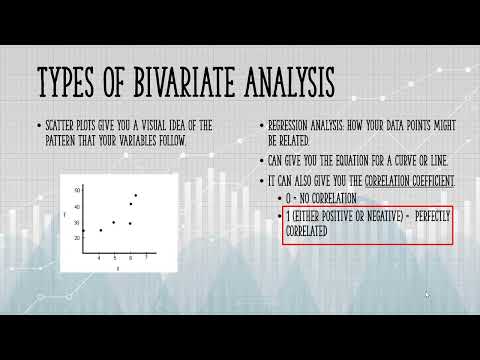
Types of Bivariate Analysis
Common types of bivariate analysis include:
1. Scatter plots,
These give you a visual idea of the pattern that your variables follow.

2. Regression Analysis
Regression analysis is a catch all term for a wide variety of tools that you can use to determine how your data points might be related. In the image above, the points look like they could follow an exponential curve (as opposed to a straight line). Regression analysis can give you the equation for that curve or line. It can also give you the correlation coefficient.
3. Correlation Coefficients
Calculating values for correlation coefficients are usually performed on a computer, although you can find the steps to find the correlation coefficient by hand here. This coefficient tells you if the variables are related. Basically, a zero means they aren’t correlated (i.e. related in some way), while a 1 (either positive or negative) means that the variables are perfectly correlated (i.e. they are perfectly in sync with each other).
References
Beyer, W. H. CRC Standard Mathematical Tables, 31st ed. Boca Raton, FL: CRC Press, pp. 536 and 571, 2002.
Gonick, L. (1993). The Cartoon Guide to Statistics. HarperPerennial.
Klein, G. (2013). The Cartoon Introduction to Statistics. Hill & Wamg.
Vogt, W.P. (2005). Dictionary of Statistics & Methodology: A Nontechnical Guide for the Social Sciences. SAGE.