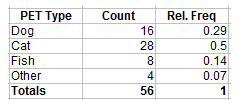
Absolute frequency is a simple count of the number of cases, items, or things. An absolute frequency distribution displays those counts, usually in a table.
Creating an Absolute Frequency Distribution
The set up for an absolute frequency distribution is simple:
- Create Two Columns.
- Enter the data you want to track in the left column. For this example, I’m using the hypothetical example of a manufacturing company who wants to track accidents within departments.
- In the right column, enter the count. For this example, it’s the number of departments reporting the stated number of accidents.
| Accidents per year | Number of Cases |
| 0 – 5 | 12 |
| 6 – 10 | 9 |
| 10 – 15 | 5 |
| 16 + | 2 |
The above table works well if your data is ordinal, interval, or ratio. The left column is in ascending order, although—depending on what data you have at hand—you could choose to use descending order instead.
Need help with a homework question? Check out our tutoring page!
Comparison to Relative Frequency Distribution
This simple table provides a good overview of the data and it’s easy to extract information. For example, the absolute frequency of 16+ accidents per department (the last row) is 2. However, it is very simplistic. Most tables of this type also include a column for relative frequency. A relative frequency distribution shows information about the percentages. For example, it would answer the question “What percentage of departments reported 16 or more accidents per year?

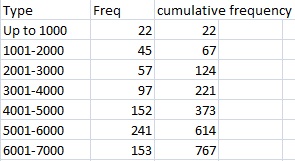
Another possibility is to add a column for cumulative frequency. Cumulative frequency shows you the totals up to a certain point. More specifically, it is the sum of the class and all classes below it in a frequency distribution. For the above example, you might want to know the total number of departments reporting more than 10 accidents per year.

References
Kotz, S. et al., eds. (2006), Encyclopedia of Statistical Sciences, Wiley.
Rubin, A. (2009). Statistics for Evidence-Based Practice and Evaluation. Cengage Learning.