You may want to read these articles first:
What is a t-statistic?
What is a z-score?
T-Score vs. Z-Score: Overview
Watch the video for an overview of when to use a t-score and when to use a z-score:
Can’t see the video? Click here to watch it on YouTube.
A z-score and a t score are both used in hypothesis testing. Few topics in elementary statistics cause more confusion to students than deciding when to use the z-score and when to use the t score. Generally, in elementary stats and AP stats, you’ll use a z-score in testing more often than a t score.
T-score vs. z-score: When to use a t score
The general rule of thumb for when to use a t score is when your sample:
- Has a sample size below 30,
- Has an unknown population standard deviation.
You must know the standard deviation of the population and your sample size should be above 30 in order for you to be able to use the z-score. Otherwise, use the t-score.
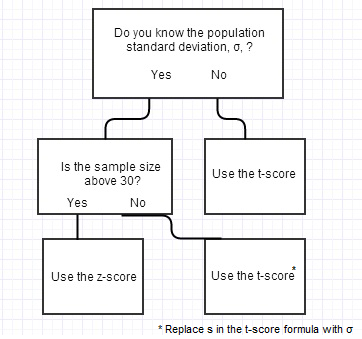
The above chart is based on (from my experience), the “rule” you’re most likely to find in an elementary statistics class. That said, this is one of those rules that isn’t set in stone, so you should always check with your textbook/teacher to make sure they aren’t suggesting something different.
In real life though, it’s more common just to use the t-distribution as we usually don’t know sigma (SoSci, 1999).
“When a sample has more than 30 observations, the normal distribution can be used in place of the t distribution.” (Meier et.al, p. 191).
Note the use of the word can in the above quote; The use of the t-distribution is theoretically sound for all sample sizes, but you *can* choose to use the normal for sample above 30.
T-Score vs. Z-Score: Z-score
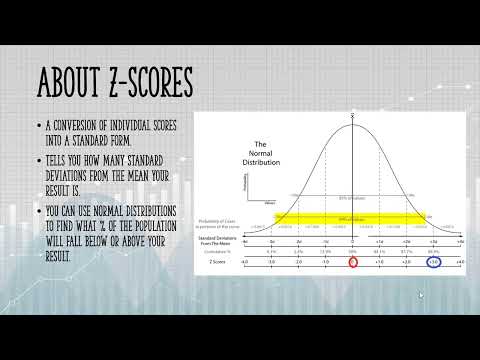
Technically, z-scores are a conversion of individual scores into a standard form. The conversion allows you to more easily compare different data; it is based on your knowledge about the population’s standard deviation and mean. A z-score tells you how many standard deviations from the mean your result is. You can use your knowledge of normal distributions (like the 68 95 and 99.7 rule) or the z-table to determine what percentage of the population will fall below or above your result.

The z-score is calculated using the formula:
Where:
- σ is the population standard deviation and
- μ is the population mean.
The z-score formula doesn’t say anything about sample size; The rule of thumb applies that your sample size should be above 30 to use it.
T-Score vs. Z-Score: T-score
Like z-scores, t-scores are also a conversion of individual scores into a standard form. However, t-scores are used when you don’t know the population standard deviation; You make an estimate by using your sample.
Where:
- s is the standard deviation of the sample.
If you have a larger sample (over 30), the t-distribution and z-distribution look pretty much the same. Therefore, you can use either. That said, if you know σ, it doesn’t make much sense to use a sample estimate instead of the “real thing”, so just substitute σ into the equation in place of s:
This makes the equation identical to the one for the z-score; the only difference is you’re looking up the result in the T table, not the Z-table. For sample sizes over 30, you’ll get the same result.
References
Everitt, B. S.; Skrondal, A. (2010), The Cambridge Dictionary of Statistics, Cambridge University Press.
Gonick, L. (1993). The Cartoon Guide to Statistics. HarperPerennial.
Meier et. al. (2014). Applied Statistics for Public and Nonprofit Administration. Cengage Learning.
SoSci. (1999). Article posted on Vermont Tech website. Retrieved 11/20/2016 from https://simon.cs.vt.edu/SoSci/converted/T-Dist/.