Regression Equation: Overview
A regression equation is used in stats to find out what relationship, if any, exists between sets of data. For example, if you measure a child’s height every year you might find that they grow about 3 inches a year. That trend (growing three inches a year) can be modeled with a regression equation. In fact, most things in the real world (from gas prices to hurricanes) can be modeled with some kind of equation; it allows us to predict future events.
A regression line is the “best fit” line for your data. You basically draw a line that best represents the data points. It’s like an average of where all the points line up. In linear regression, the regression line is a perfectly straight line:
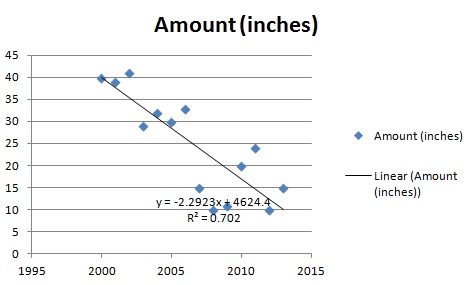
The regression line is represented by an equation. In this case, the equation is -2.2923x + 4624.4. That means that if you graphed the equation -2.2923x + 4624.4, the line would be a rough approximation for your data.
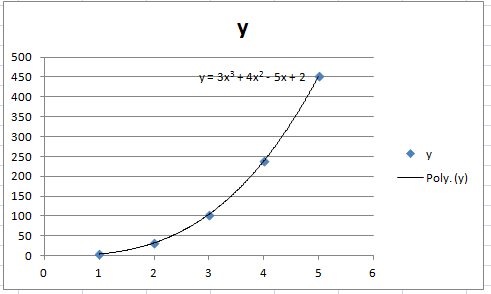
It’s not very common to have all the data points actually fall on the regression line. In the above image, the dots are slightly scattered around the line. In this next image, the dots fall on the line. The curved shape of this line is as a result of polynomial regression, which fits the points to a polynomial equation.
Regression Lines and Prediction
Regression is useful as it allows you to make predictions about data. The first chart above goes from 1995 to 2015. If you wanted to predict what would happen in 2020, you could plug it into the equation:
-2.2923(2020)+4626.4 = -4.046.
Having a negative rainfall doesn’t make too much sense, but you can say that rainfall is going to drop to 0 inches sometime before 2020. According to this particular regression line, it actually is predicted to happen sometime in 2018:
-2.2923(2018)+4626.4 = 0.5386
-2.2923(2019)+4626.4 = -1.7537
What is a Regression Equation used For?
Regression equations can help you figure out if your data can be fit to an equation. This is extremely useful if you want to make predictions from your data–either future predictions or indications of past behavior. For example, you might want to know what your savings are going to be worth in the future. Or, you might want to predict how long it can take to recover from an illness.
There are several types of regression equations. Some of the more common include exponential and simple linear Regression (to fit the data to an exponential equation or a linear equation). In elementary statistics, the regression equation you are most likely to come across is the linear form.
Calculating Linear Regression
Need help with a homework question? Check out our tutoring page!
There are several ways to find a regerssion line, including by hand and with technology, like Excel (see below). Finding a regression is very tedious by hand.
You can also find a regression line on the TI calculators:
The linear regression equation is shown below.

Downside of Regression Analysis
In order to make data fit an equation, you have to figure out what general pattern the data fits first. The general steps to performing regression include first making a scatter plot and then making a guess as to what kind of equation might be the best fit. Then you can select the best regression equation for the job.

However, as the following image shows, it isn’t always completely straightforward to select the appropriate regression equation, especially when you’re dealing with real life data. Sometimes you get “noisy” data that doesn’t seem to quite fit any equation. If the bulk of the data looks like it follows a pattern, you could omit the outliers. In fact, if you ignore outliers, the data looks like it could be modeled by an exponential equation.
Regression Equation in Microsoft Excel 2007/2010
 One benefit of using Excel to plot your data is that you can play around with the regression equation until you have something that works. You only need to type your data in once, then you can add and delete as many graphs as you wish.
Regression Equation Microsoft Excel: Steps
Example Problem: Find the regression equation for the following data set using Microsoft Excel 2007 or 2010:
- x = 1, 2, 3, 4, 5, 6, 7
- y = 1, 3, 6, 12, 24, 39, 50
Step 1: Type your data into two columns. Place the x-values in column A and your y-values in column B.
Step 2: Highlight the two columns: Click in cell A1 and then drag the cursor to cell B7.
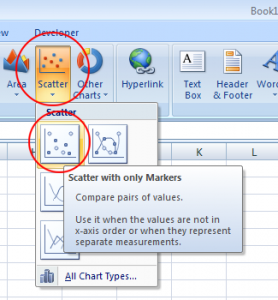
Step 3: Click “Insert,” then click “Scatter” and then click “Scatter with only markers.”
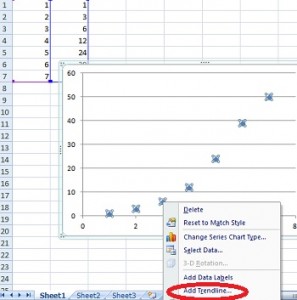
Step 4: Select any data point on the graph. In other words, select an actual data point — “X” will appear over each point on the graph. Right-click and then click “Add trendline.
Step 5: Choose a type of regression. The data suggests that this might be an exponential equation, so click the “Exponential” radio button.
Step 6: Click the “Display Equation on chart” box and then click “Close.” The regression equation for this particular Excel graph is y=8.4643x-14.571.
Tip: If your graph line doesn’t look right, repeat the steps and see if another type of regression (for example, linear) might fit better.
Check out our Youtube channel for more tips and help for stats!
References
Gonick, L. (1993). The Cartoon Guide to Statistics. HarperPerennial.
Kotz, S.; et al., eds. (2006), Encyclopedia of Statistical Sciences, Wiley.