What is an Interquartile Range?
The interquartile range (IQR) is the central half of any dataset.
While a range is a measure of where the beginning and end are in a set, an interquartile range is a measure of where the bulk of the values lie. That’s why it’s preferred over many other measures of spread when reporting things such as school performance or SAT scores.
The interquartile range formula is the first quartile subtracted from the third quartile:
The IQR gives us a sense of the data’s spread around the median, excluding possible outliers. Therefore, the interquartile range is often more informative than the range for datasets that contain outliers or are skewed.
The IQR is often preferred to the range because it has a breakdown point of 25% [2]. This means that up to 25% of data point can be outliers and the IQR will hold its ground as a good measure of spread. Go above 25% outliers, and the IQR may become meaningless. In comparison, the range has a breakdown point of 0% — just a single outlier can render the range meaningless.
Watch the video for how to calculate the interquartile range by hand:

Can’t see the video? Click here to watch it on YouTube.
Contents:
Solving by hand:
- Solve the formula by hand (odd set of numbers).
- What if I have an even set of numbers?
- Find an interquartile range for an odd set of numbers: Second Method
- Box Plot interquartile range: How to find it
Using Technology:
- Interquartile Range in Minitab
- Interquartile Range in Excel
- Interquartile Range in SPSS
- Interquartile Range on the TI83
- Q1, Q3 and the IQR on the TI89
General info:
- What is the IQR used for?
- Interpreting the interquartile range.
- IQR as a Test for Normal Distribution.
- What is an Interquartile Range used for?
- History of the Interquartile Range.
- Difference between range and IQR.
Solve the formula by hand
Example question: (Odd set of numbers). What is the IQR for the dataset 1, 2, 5, 6, 18, 19, 27, 7, 9, 12, 15?
Steps:
- Order the numbers from smallest to largest: 1, 2, 5, 6, 7, 9, 12, 15, 18, 19, 27.
- Find the median (the middle number): 1, 2, 5, 6, 7, 9, 12, 15, 18, 19, 27.
- Find Q1 (the median of the set of numbers below the median): 1, 2, 5, 6, 7.
- Find Q3 (the median of the set of numbers above the median): 12, 15, 18, 19, 27.
- Subtract Q1 from Q3 : 18 – 5 = 13.
Solution: The IQR is 13.
What if I Have an Even Set of Numbers?
Example question: Find the IQR for the following data set: 3, 5, 7, 8, 9, 11, 15, 16, 20, 21.
- Order the numbers from smallest to largest: 3, 5, 7, 8, 9, 11, 15, 16, 20, 21.
- Find the median. As this is an even set of numbers the median will be av average of the two middle numbers: 3, 5, 7, 8, 9 (10), 11, 15, 16, 20, 21.
- Find Q1 (the median of the set of numbers below the median): 3, 5, 7, 8, 9.
- Find Q3 (the median of the set of numbers above the median): 11, 15, 16, 20, 21.
- Subtract Q1 from Q3 : 16 – 7 = 9.
Solution: The IQR is 9.
Find an interquartile range for an odd set of numbers: Alternate Method
As you may already know, nothing is “set in stone” in statistics: when some statisticians find an interquartile range for a set of odd numbers, they include the median in both both quartiles.
For example, in the following set of numbers: 1, 2, 5, 6, 7, 9, 12, 15, 18, 19, 27 some statisticians would break it into two halves, including the median (9) in both halves: (1, 2, 5, 6, 7, 9), (9, 12, 15, 18, 19, 27).
This leads to two halves with an even set of numbers, so you can follow the steps above to find the IQR.
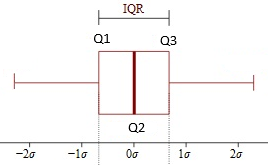
Box Plot interquartile range: How to find it

Example question: Find the interquartile range for the above box plot.
- Find Q1. Q1 is represented by the left hand edge of the “box” (at the point where the whisker stops).

In the above graph, Q1 is approximately at 2.6.
- Find Q3. Q3 is represented on a boxplot by the right hand edge of the “box”.

Q3 is approximately 12 in this graph.
- Subtract the number you found in step 1 from the number you found in step 3. This will give you the interquartile range. 12 – 2.6 = 9.4.


That’s it!
Interquartile Range in Minitab
Watch the video for step-by-step directions:
Can’t see the video? Click here to watch it on YouTube.
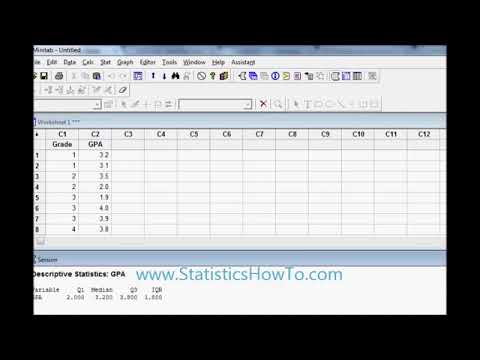
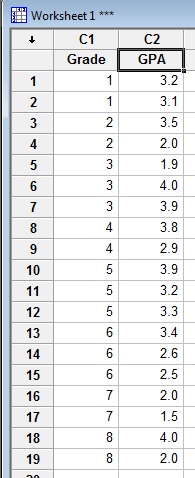
Example question: Find an interquartile range in Minitab for the Grade Point Average (GPA) in the following data set: Grade Point Average (GPA): 1(3.2), 1(3.1), 2(3.5), 2(2.0), 3(1.9), 3(4.0), 3(3.9), 4(3.8), 4(2.9), 5(3.9), 5(3.2), 5(3.3), 6(3.4), 6(2.6), 6(2.5), 7(2.0), 7(1.5), 8(4.0), 8(2.0).
- Type your data into a Minitab worksheet. Enter your data into one or two columns.

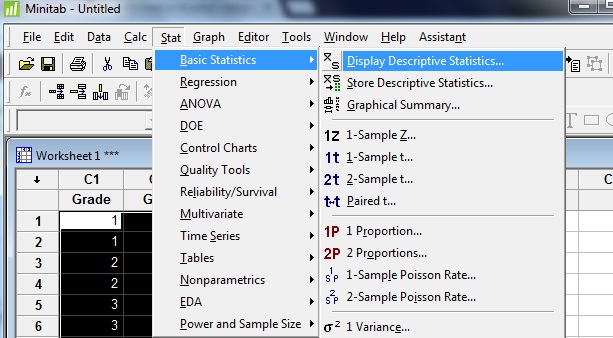
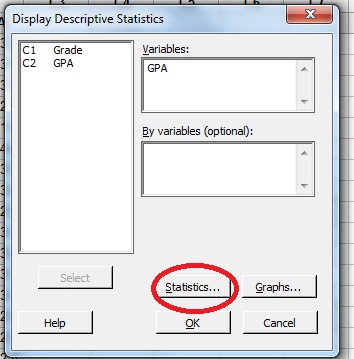
- Click “Stat,” then click “Basic Statistics,” then click “Display Descriptive Statistics” to open the Descriptive Statistics menu.

- Click a variable name in the left window and then click the “Select” button to transfer the variable name to the right-hand window.
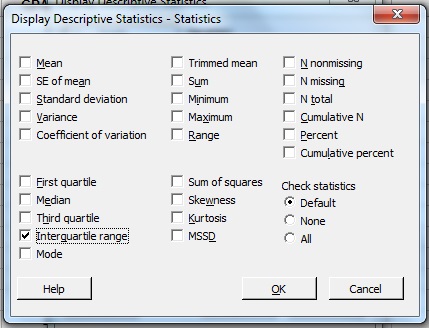
- Click the “Statistics” button.

- Check “Interquartile Range.”

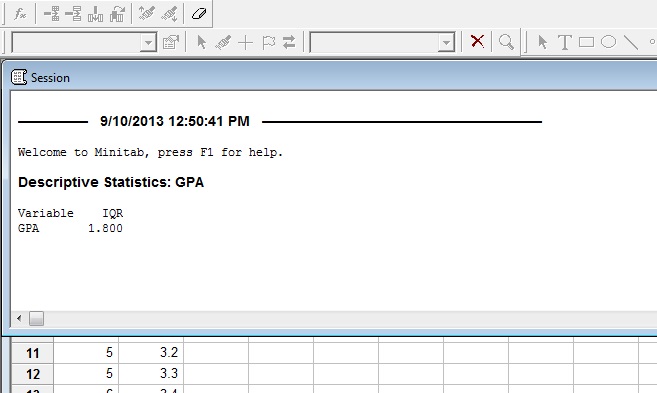
- Click the “OK” button (a new window will open with the result). The IQR for the GPA in this particular data set is 1.8.

That’s it!
Tip: If you don’t see descriptive statistics show in a window, click “Window” on the toolbar, then click “Tile.” Click the Session window (this is where descriptive statistics appear) and then scroll up to see your results.
Interquartile Range in Excel 2007
Steps:
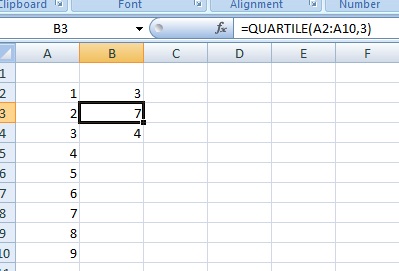
- Enter your data into a single Excel column on a worksheet. For example, type your data in cells A2 to A10. Don’t leave any gaps in your data.
- Click a blank cell (for example, click cell B2) and then type =QUARTILE(A2:A10,1). You’ll need to replace A2:A10 with the actual values from your data set. For example, if you typed your data into B2 to B50, the equation is =QUARTILE(B2:B50,1). The “1” in this Excel formula(A2:A10,1) represents the first quartile (i.e the point lying at 25% of the data set).
- Click a second blank cell (for example, click cell B3) and then type =QUARTILE(A2:A10,3). Replace A2:A10 with the actual values from your data set. The “3” in this Excel formula (A2:A10,3) represents the third quartile (i.e. the point lying at 75% of the data set).
- Click a third blank cell (for example, click cell B4) and then type =B3-B2. If your quartile functions from Step 2 and 3 are in different locations, change the cell references.
- Press the “Enter” key. Excel will return the IQR in the cell you clicked in Step 4.
That’s it!
How to Find an Interquartile Range in SPSS
Like most technology, SPSS has several ways that you can calculate the IQR. However, if you click on the most intuitive way you would expect to find it (“Descriptive Statistics > Frequencies”), the surprise is that it won’t list the IQR (although it will list the first, second and third quartiles). You could take this route and then subtract the third quartile from the first to get the IQR. However, the easiest way to find the interquartile range in SPSS by using the “Explore” command.
If you have already typed data into your worksheet, skip to Step 3.
Watch the video below for a step by step guide:

Can’t see the video? Click here to watch it on YouTube.
Steps
- Open a new data file in SPSS. Click “File,” mouse over “New” and then click “Data.”
- Type your data into columns in the worksheet. You can use as many columns as you need, but don’t leave blank rows or spaces between your data. See: How to Enter Data into SPSS.
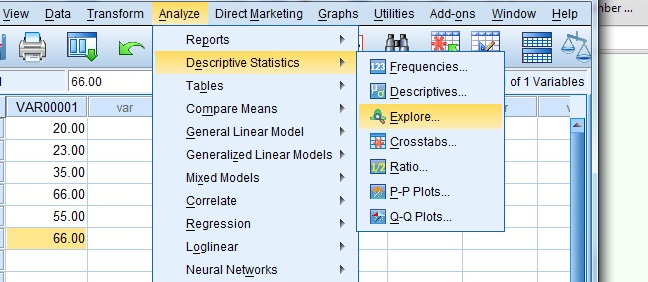
- Click “Analyze,” then mouse over “Descriptive Statistics.” Click “Explore” to open the “Explore” dialog box.

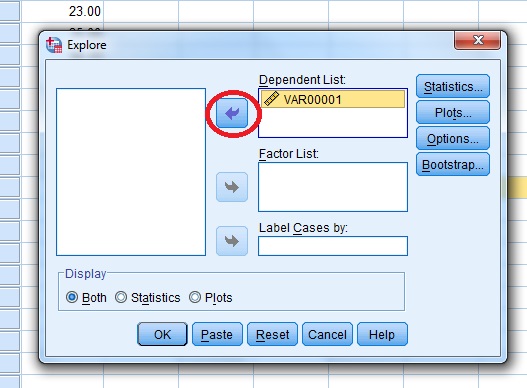
- Click the variable name (that’s just a fancy name for the column heading), then click the top arrow to move the variable into the “Dependent list” box.

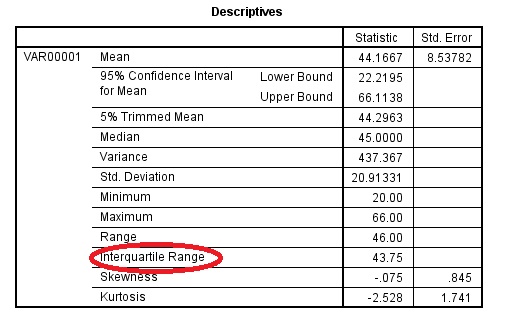
The “Explore” variables dialog box. - Click “OK.” The interquartile range is listed in the Descriptives box.

Tip: This example has only one list typed into the data sheet, but you may have several to choose from depending on how you entered your data. Make sure you select the right variable (column names) before proceeding. If you want more memorable variable names, change the column title by clicking the “variable view” button at the very bottom left of the worksheet. Type in your new variable name and then return to data view by clicking the “data view” button.
Interquartile Range using the TI83
Watch the video below for the steps:

Can’t see the video? Click here to watch it on YouTube.
While you can use the nifty online interquartile range calculator on this website, that might not be an option in a quiz or test. Most instructors allow the use of a TI-83 on tests, and it’s even one of the few calculators allowed in the AP Statistics exam. Finding the TI 83 interquartile range involves nothing more than entering your data list and pushing a couple of buttons.
Example problem: Find the TI 83 interquartile range for the heights of the top 10 buildings in the world (as of 2009). The heights, (in feet) are: 2717, 2063, 2001, 1815, 1516, 1503, 1482, 1377, 1312, 1272.
-
- Enter the above data into a list on the TI 83 calculator. Press the STAT button and then press ENTER. Enter the first number (2717), and then press ENTER. Continue entering numbers, pressing ENTER after each entry.
- Press the STAT button.
- Press the right arrow button (the arrow keys are located at the top right of the keypad) to select “Calc.”
- Press ENTER to highlight “1-Var Stats.”
- Press ENTER again to bring up a list of stats.
- Scroll down the list with the arrow keys to find Q1 and Q3. Write those numbers down. You could copy and paste the numbers but unfortunately, Texas Instruments doesn’t make this easy:
- Use the arrow keys to place the cursor at the beginning of the text that you want to highlight.
- Using the TI Keyboard, press and hold down the Shift key, and then use the arrow keys to highlight the text.
- Release the Shift key and arrow key.
The copy and paste menu should appear, enabling you to copy and paste the data. You would have to do this twice (returning to the HOME screen each time), so it’s much faster just to write the numbers down.
- Subtract Q1 from Q3 to find the IQR (strong>624 feet for this set of numbers).
That’s it!
How to Find Q1, Q3 and the Interquartile Range on the TI 89
Example problem: Find Q1, Q3, and the IQR for the following list of numbers: 1, 9, 2, 3, 7, 8, 9, 2.
- Press APPS. Scroll to Stats/List Editor (use the arrow keys on the keypad to scroll). Press ENTER. If you don’t have the stats/list editor you can download it here.
- Clear the list editor of data: press F1 8.
- Press ALPHA 9 ALPHA 1 ENTER. This names your list “IQ.”
- Enter your numbers, one at a time. Follow each entry by pressing the ENTER key. For our group of numbers, enter 1,9,2,3,7,8,9,2
- Press F4, then ENTER (for the 1-var stats screen).
- Tell the calculator you want stats for the list called “IQ” by entering ALPHA 9 ALPHA 1 into the “List:” box. The calculator should automatically put the cursor there for you. Press ENTER twice.
- Read the results. Q1 is listed as Q1X (in our example, Q1X=2). Q3 is listed as Q3X (Q3X=8.5). To find the IQR, subtract Q1 from Q3 on the Home screen. The IQR is 8.5-2=6.5.
That’s it!
What is the interquartile range used for?
The IQR serves several purposes in data analysis and data visualization. One of its primary applications it to create box plots. These are simple graphical illustrations that give us a visual understanding of the spread of a probability distribution.
In business, the IQR offers an effective way to understand the spread of income within a company or industry, providing insights into income inequality, wage gaps, and general financial health.
For symmetric distributions, where the median is equal to the midhinge (the average of the first and third quartiles), the IQR has another interesting property. In such cases, half of the IQR is equivalent to the Median Absolute Deviation (MAD), a robust measure of dispersion.
The IQR’s relationship with the median, a measure of central tendency, is also important. The median splits the data into two halves, while the IQR focuses on the middle 50% of data, which gives us a more informative view of the dataset’s central values.
Another important use for the IQR is in outlier detection. By defining the ‘expected range’ of values, any data point falling significantly outside this range can be classified as an outlier. This helps in maintaining the integrity of data analysis.
The IQR might also indicate the skewness of a dataset, providing insights into whether the distribution leans more towards higher or lower values. Finally, the concept of the quartile deviation, or semi-interquartile range, is defined as half the IQR, further emphasizing its importance in understanding data dispersion.
Interpreting the interquartile range
The interquartile range is more than just a number — it can tell us something about the variation in the middle fifty percent of data. In fact, the IQR is perhaps the best measure of variability for skewed distributions or data sets with outliers or extreme values; it is robust to their effects because the IQR only uses the middle 50%.
Consider the following example [3]:
The list includes the count of nuclear power plants in the top 15 nuclear power-generating nations globally. Determine the first, second, and third quartiles of this dataset. What insights can you draw from the interquartile range? (Source of data: International Atomic Energy Agency)
7, 18, 11, 6, 59, 17, 18, 54, 104, 20, 31, 8, 10, 15, 19.
- Order the data set and find the median: 6 7 8 10 11 15 17 18 18 19 20 31 54 59 104
- Find Q1, the median of the lower half: 6 7 8 10 11 15 17.
- Find Q3, the median of the upper half: 18 19 20 31 54 59 104.
- Find the IQR: Q3 – Q1 = 31 – 10 = 21.
This means that the number of power plants in the middle 50% of data varies by at most, 21.
IQR as a test for a normal distribution
Use the interquartile range formula with the mean and standard deviation to test whether or not a population has a normal distribution.
The formula to determine whether or not a population is normally distributed is:
Q1 – (σ z1) + X Q3 – (σ z3) + X
Where
- Q1 is the first quartile,
- Q3 is the third quartile,
- σ is the standard deviation,
- z is the standard score (“z-score“) and
- X is the mean.
To tell whether a population is normally distributed, solve both equations and then compare the results. If there is a significant difference between the results and the first or third quartiles, then the population is not normally distributed.
What is an Interquartile Range Used For?
The IQR is used to measure how spread out the data points in a set are from the mean of the data set. The higher the IQR, the more spread out the data points; in contrast, the smaller the IQR, the more bunched up the data points are around the mean. The IQR range is one of many measurements used to measure how spread out the data points in a data set are. It is best used with other measurements such as the median and total range to build a complete picture of a data set’s tendency to cluster around its mean. Back to Top
History: Where Does the term Interquartile Range Come From?
British physician Sir Donald MacAlister used the terms lower quartile and higher quartile in the 1879 publication, the Law of the Geometric Mean. Proc. R. Soc. XXIX, p. 374: ” “As these two measures, with the mean, divide the curve of facility into four equal parts, I propose to call them the ‘higher quartile’ and the ‘lower quartile’ respectively.” 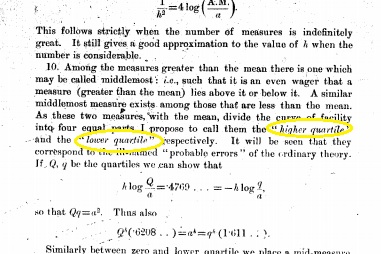
Although a physician by trade, he was gifted with mathematics and achieved the highest score in the final mathematics exams at Cambridge University in 1877. He spoke nineteen languages including English, Czech and Swedish.
Macalister’s paper, the Law of the Geometric Mean was in response to a question put forward by Francis Galton (inventor of the Galton board). However, it wasn’t until 1882 that Galton (“Report of the Anthropometric Committee”) used the upper quartile and lower quartile values and the term “interquartile range” —defined as twice the probable error.
Galton wasn’t just a statistician—he was also an anthropologist, geographer, proto-geneticist and psychometrician who produced more than 340 books. He also coined the statistical terms “correlation” and “regression toward the mean.”
What’s the difference between the range and interquartile range?
The range and the interquartile range are both measures of variability; they tell us about the spread of data in different ways. The range gives us a measure of the total spread of the data by subtracting the smallest value from the largest value in the dataset, giving us an idea of how widely the data is spread across the entire dataset.
On the other hand, the interquartile range focuses on the middle 50% of data values. It is calculated by subtracting the first quartile (the 25th percentile) from the third quartile (the 75th percentile). This measurement provides a sense of the data’s spread around the median, excluding the extreme values which could be outliers. Therefore, the interquartile range is often more informative than the range for datasets that contain outliers or are skewed.
The IQR is often preferred to the range because it has a breakdown point of 25%. This means that up to 25% of data point can be outliers and the IQR will hold its ground as a good measure of spread. Go above 25% outliers, and the IQR may become meaningless. In comparison, the range has a breakdown point of 0%, which means that just a single outlier can render the range meaningless.
References
- By Jhguch at en.wikipedia. CC by 3.0.
- Kaltenbach, Hans-Michael (2012). A concise guide to statistics. Heidelberg: Springer. ISBN 978-3-642-23502-3. OCLC 763157853.
- Larson, R. & Farber, B. Elementary statistics: Picturing the world. 5th edition. Prentice Hall. Retrieved 7/1/23 from oxy.edu [PDF].