Probability Distributions > Multinomial Distribution
The multinomial distribution is used to find probabilities in experiments where there are more than two outcomes.
Binomial vs. Multinomial Experiments
The first type of experiment introduced in elementary statistics is usually the binomial experiment, which has the following properties:
- Fixed number of n trials.
- Each trial is an independent event.
- Only two outcomes are possible (Success and Failure).
- Probability of success (p) for each trial is constant.
- A random variable Y= the number of successes.
A multinomial experiment is almost identical with one main difference: a binomial experiment can have two outcomes, while a multinomial experiment can have multiple outcomes.
Example: You roll a die ten times to see what number you roll. There are 6 possibilities (1, 2, 3, 4, 5, 6), so this is a multinomial experiment. If you rolled the die ten times to see how many times you roll a three, that would be a binomial experiment (3 = success, 1, 2, 4, 5, 6 = failure).
A binomial experiment will have a binomial distribution. A multinomial experiment will have a multinomial distribution.
Multinomial Distribution Example
Three card players play a series of matches. The probability that player A will win any game is 20%, the probability that player B will win is 30%, and the probability player C will win is 50%. If they play 6 games, what is the probability that player A will win 1 game, player B will win 2 games, and player C will win 3?
Use the following formula to calculate the odds (Need help? Check out our tutoring page!):
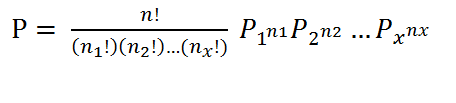
where:
- n = number of events
- n1 = number of outcomes, event 1
- n2 = number of outcomes, event 2
- n3 = number of outcomes, event x
- p1 = probability event 1 happens
- p2 = probability event 2 happens
- px = probability event x happens
Using the data from the question, we get:
- n = 12 (6 games total).
- n1 = 1 (Player A wins).
- n2 = 2 (Player B wins).
- n3 = 3 (Player C wins).
- p1 = 0.20 (probability that Player A wins).
- p2 = 0.30 (probability that Player B wins).
- p3 = 0.50 (probability that Player C wins).
Putting this into the formula, we get:
![]()
Check out our YouTube channel for hundreds of statistics help videos!
References
Beyer, W. H. CRC Standard Mathematical Tables, 28th ed. Boca Raton, FL: CRC Press, p. 532, 1987.
Papoulis, A. Probability, Random Variables, and Stochastic Processes, 2nd ed. New York: McGraw-Hill, 1984.