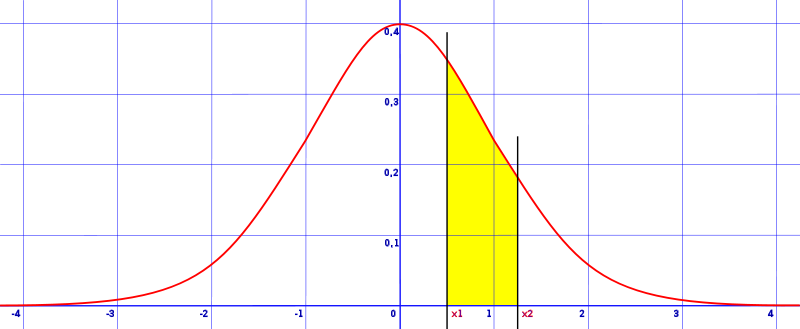
Normal distribution curve index > Area between two z scores
How to Find the Area Between Two Z Scores on One Side of the Mean
Watch the video for an example:
If you want to find the area between two z scores, the technique will differ slightly depending on whether you have two scores on one side of the mean or on opposite sides of the mean. This article will show you how to find the area between two z scores on one side of the mean. If you have z scores on opposite sides, see: Area Between Two Z Values on Opposite Sides of the Mean.
A z score is a measurement of how many standard deviations from the mean you are. For example:
- A score of 1.0 tells you that you are one standard deviation from the mean in a positive direction (on the number line),
- A score of -2.0 means you are two standard deviations from the mean in a negative direction.
The values in a z-table are percentages under the curve. As the total area under a curve is 100%, the values you get from a z-table will always be less than that. The z-table uses decimal forms of percentages (e.g. 0.2 for 20%).
How to find the area between two z scores on one side of the mean

Step 1: Split your z-scores after the tenths place. For example, if you have z score of 1.95 and 2.13, they become 1.9 + 0.05 and 2.1 + .03.
Step 2: Look in the z-table for your z-scores (you should have two from Step 1) by finding the intersections. For example, if you are asked to find the area from z = -0.46 to z = -0. 04, look up both 0.46 and 0.04 (see note below about negative numbers). The table below illustrates the result for 0.46* (0.4 in the left hand column and 0.06 in the top row. The intersection is .1772).
| z | 0.00 | 0.01 | 0.02 | 0.03 | 0.04 | 0.05 | 0.06 | 0.07 | 0.08 | 0.09 |
|---|---|---|---|---|---|---|---|---|---|---|
| 0.0 | 0.0000 | 0.0040 | 0.0080 | 0.0120 | 0.0160 | 0.0199 | 0.0239 | 0.0279 | 0.0319 | 0.0359 |
| 0.1 | 0.0398 | 0.0438 | 0.0478 | 0.0517 | 0.0557 | 0.0596 | 0.0636 | 0.0675 | 0.0714 | 0.0753 |
| 0.2 | 0.0793 | 0.0832 | 0.0871 | 0.0910 | 0.0948 | 0.0987 | 0.1026 | 0.1064 | 0.1103 | 0.1141 |
| 0.3 | 0.1179 | 0.1217 | 0.1255 | 0.1293 | 0.1331 | 0.1368 | 0.1406 | 0.1443 | 0.1480 | 0.1517 |
| 0.4 | 0.1554 | 0.1591 | 0.1628 | 0.1664 | 0.1700 | 0.1736 | 0.1772 | 0.1808 | 0.1844 | 0.1879 |
| 0.5 | 0.1915 | 0.1950 | 0.1985 | 0.2019 | 0.2054 | 0.2088 | 0.2123 | 0.2157 | 0.2190 | 0.2224 |
Step 3: Subtract the smaller z-value you just found in step 2 from the larger value.
That’s it!
*note. The normal distribution has a symmetrical graph. As z-scores are drawn from this distribution, it means you look up absolute values. For example, if you are asked to find the area between two z scores of -0.40 to -0.46, look up 0.40 and 0.46.