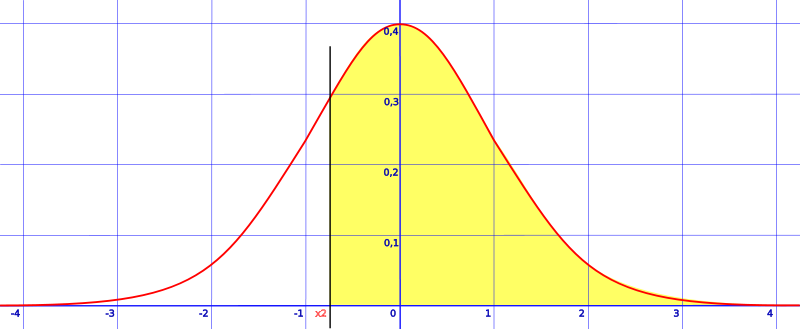
Probability and Statistics > Normal Distributions > Area to the Right of a z score
How to find the Area to the Right of a z score
There are a few ways to find the area to the right of a z-score where z is less than the mean. With any word problem like this, you’ll need to consult the z-table. The z-table gives you the area between points (i.e. the area to the right of a z score). Once you know how to read a z-table, finding the area only takes seconds!
Watch the video for an example:
If you are looking for other variations of word problems like this (for example, finding the area for a value between 0 and any z-score, or between two z-scores, see the normal distribution curve index). That index also includes pictures of all the different types of areas under the curve to help you with choosing the right article.
How to find the Area to the Right of a z score: Steps

Step 1: Split your z-score into two, after the tenths decimal place. For example, 0.46 becomes 0.4 + 0.06.
Step 2: Look in the z-table for the given z-value. In order to look up a value in the z-table, find the intersection. The table below shows the result for 0.46 (0.4 in the left hand column and 0.06 in the top row. The intersection is .1772).
| z | 0.00 | 0.01 | 0.02 | 0.03 | 0.04 | 0.05 | 0.06 | 0.07 | 0.08 | 0.09 |
|---|---|---|---|---|---|---|---|---|---|---|
| 0.0 | 0.0000 | 0.0040 | 0.0080 | 0.0120 | 0.0160 | 0.0199 | 0.0239 | 0.0279 | 0.0319 | 0.0359 |
| 0.1 | 0.0398 | 0.0438 | 0.0478 | 0.0517 | 0.0557 | 0.0596 | 0.0636 | 0.0675 | 0.0714 | 0.0753 |
| 0.2 | 0.0793 | 0.0832 | 0.0871 | 0.0910 | 0.0948 | 0.0987 | 0.1026 | 0.1064 | 0.1103 | 0.1141 |
| 0.3 | 0.1179 | 0.1217 | 0.1255 | 0.1293 | 0.1331 | 0.1368 | 0.1406 | 0.1443 | 0.1480 | 0.1517 |
| 0.4 | 0.1554 | 0.1591 | 0.1628 | 0.1664 | 0.1700 | 0.1736 | 0.1772 | 0.1808 | 0.1844 | 0.1879 |
| 0.5 | 0.1915 | 0.1950 | 0.1985 | 0.2019 | 0.2054 | 0.2088 | 0.2123 | 0.2157 | 0.2190 | 0.2224 |
Step 3: Add 0.500 to the z-value you just found in step 2.
That’s it!
Note: Because the graphs are symmetrical, you can ignore the negative z-values and just look up their positive counterparts (in other words, their absolute value). For example, if you are finding an area to the right of a z score and the area of a tail on the left is -0.46, just look up 0.46.
Why am I Adding 50%?
Unfortunately, there are many variations on z-tables in textbooks. However, all of them work on the same assumption that the area under the graph of a normal distribution equals 100%. You might see a whole z-table from -3 to 3, or you might see two halves (like the ones I use on this site). You’ll know if you’re using a half table if the z-values range from zero to 3+.
You’re adding the .500 here because that’s the whole area of the right side of the graph (i.e. half of 100% is 50%). You need to add that to your calculation in order to cover the entire area (the yellow area in the top image). The golden rules:
- Always sketch a graph,
- Always check which z-table you’re using.
Check out our Youtube channel for hundreds of statistics help videos!