A hierarchical model is a model in which lower levels are sorted under a hierarchy of successively higher-level units.
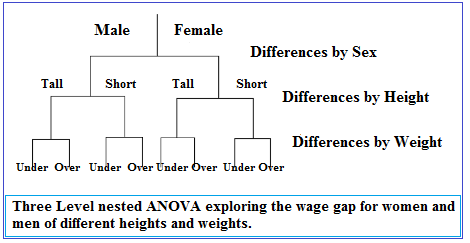
Data is grouped into clusters at one or more levels, and the influence of the clusters on the data points contained in them is taken account in any statistical analysis. For example, in a survey investigating the wage gap between men and women, people might be sub-grouped by height and weight to see if those factors make a difference in results:
How a Hierarchical Model Affects Statistics
The key idea behind doing statistics with hierarchical models is that inferences which are made about one quantity affect inference about another. In general linear models, observations are considered independent of each other. Hierarchical models are different because the observations make up what are called clusters, and the clusters share certain attributes and similarities.
For instance, if we’re studying the worldview of children in a certain town, we may find that children are more likely to share views and beliefs with other children in their immediate family, and are also more likely to share views and beliefs with other children in their socio-economic and cultural groups than children from widely differing backgrounds. A basic linear model that didn’t take into account these clusters would be flawed from the outset. A hierarchical model allows us to take into account the influences of these clusters as well as the interaction between them.
Accounting for Hierarchical Clusters in Statistics
There are a number of different ways that the correlations, interactions, and influences of hierarchical models can be accounted for in statistical analysis. In simple linear regression, where we try to fit our data to a straight line, the effects of a cluster can be addressed by allowing multiple levels of random effects, or residuals specific to the clusters.
We can also find the correlation coefficient between members of clusters, and that can be used to set up variables that show the ‘fixed effects’ that are taking place between related data points. These correlations will be represented by coefficients in a modeling equation.
References
Blei, D. (2011). Hierarchical Models. Retrieved from
https://www.cs.princeton.edu/courses/archive/fall11/cos597C/lectures/hierarchical-models.pdf on Feb 3, 2018
Dominici, F. (2009). Introduction to Multi-level Models. Retrieved February 7, 2018 from:
http://www.biostat.jhsph.edu/~fdominic/teaching/bio656/lectures/1.intro.pdf
Fitzmaurice, G. (n.d.) Overview of Methods for Analyzing Cluster-Correlated Data
Retrieved from https://catalyst.harvard.edu/docs/biostatsseminar/Fitzmaurice_BSP-Workshop-Slides.pdf on Feb 4, 2018
Harvard University. (n.d.) Hierarchical (Multilevel) Models for Survey Data. Retrieved from https://sites.fas.harvard.edu/~stats/survey-soft/hierarchical.html on Feb 3, 2018
Levy, R. (2012). Hierarchical Modeling. Retrieved from
http://idiom.ucsd.edu/~rlevy/pmsl_textbook/chapters/pmsl_8.pdf on Feb 3, 2018