Empirical Distribution Function Definition
An empirical cumulative distribution function (also called the empirical distribution function, ECDF, or just EDF) and a cumulative distribution function are basically the same thing: they are both probability models for data. However, while a CDF is a hypothetical model of a distribution, the ECDF models empirical (i.e. observed) data. To put this another way, the ECDF is the probability distribution you would get if you sampled from your sample, instead of the population. Let’s say you have a set of experimental (observed) data x1, x2 …,xn. The EDF will give you the fraction of sample observations less than or equal to a particular value of x.
More formally, if you have a set of order statistics (y1 < y2 < … < yn) from an observed random sample, then the empirical distribution function is defined as a sum of iid random variables:
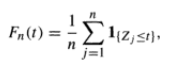
Where I = the indicator function (Mahmoud, 2000).
The formula is actually easier to work than it looks. The following example shows how you can use the formula to generate an EDF for your experimental data, and how the EDF can be used as a comparison against a hypothetical distribution.
How to use the formula to create an EDF from data
Let’s say you had 50 observations from an experiment. To create the EDF:
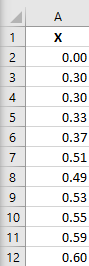
Step 1: Enter your data into column A of a spreadsheet. Sort into ascending order (smallest to greatest). Note: I’m only showing the first 11 values in this image due to space constraints, but you should enter all of yours.
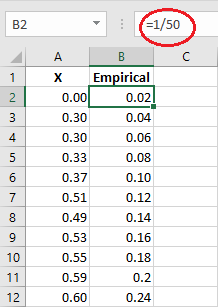
Step 2: In column B, type k/n, where:
- “k” is the numbered observation (this is easy, it’s just 1, 2, 3, 4, 5…)
- “n” is the number in your sample. For this example, I have 50 observations, so I entered 1/50.
For this example (the truncated 11 observations), my entries are 1/50, 2/50, 3/50, 4/50, 6/50, 7/50, 8/50, 9/50, 10/50 and 11/50:
That’s it!
Using the EDF as a comparison
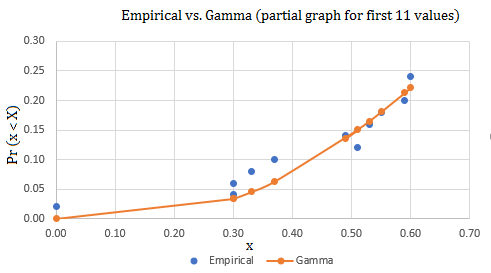
If you want to compare your data to another distribution, then just enter the distribution’s values into column C. For example, the next image shows values for the gamma distribution for α = 4 and β = .25, although you can compare your data to whatever probability distribution you wish.
Note: You can find instructions for entering gamma values into Excel on the gamma distribution page):
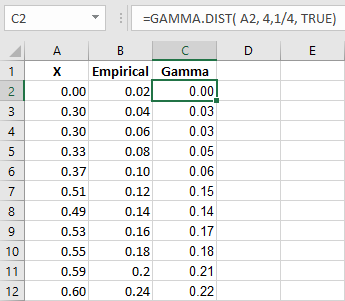
The resulting scatter plot gives you a visual on whether the values match up with your chosen theoretical distribution. From this limited data, it looks like the empirical data could be quite a good match for the gamma distribution:
References
Empirical distribution functions. Retrieved 11/2/2017 from: http://homepages.cae.wisc.edu/~ie642/content/Techniques/EmpiricalDistributions/empirica.htm
Mahmoud, H. (2000). Sorting: A Distribution Theory. John Wiley & Sons.