Statistics Definitions > Durbin Watson Test & Coefficient
What is The Durbin Watson Test?
The Durbin Watson Test is a measure of autocorrelation (also called serial correlation) in residuals from regression analysis. Autocorrelation is the similarity of a time series over successive time intervals. It can lead to underestimates of the standard error and can cause you to think predictors are significant when they are not. The Durbin Watson test looks for a specific type of serial correlation, the AR(1) process.
The Hypotheses for the Durbin Watson test are:
H0 = no first order autocorrelation.
H1 = first order correlation exists.
(For a first order correlation, the lag is one time unit).
Assumptions are:
- That the errors are normally distributed with a mean of 0.
- The errors are stationary.
The test statistic is calculated with the following formula:
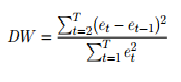
Where Et are residuals from an ordinary least squares regression.
The Durbin Watson test reports a test statistic, with a value from 0 to 4, where:
- 2 is no autocorrelation.
- 0 to <2 is positive autocorrelation (common in time series data).
- >2 to 4 is negative autocorrelation (less common in time series data).
A rule of thumb is that test statistic values in the range of 1.5 to 2.5 are relatively normal. Values outside of this range could be cause for concern. Field(2009) suggests that values under 1 or more than 3 are a definite cause for concern.
The Durbin Watson test is rarely used and is considered by some to be archaic. It requires the use of tables, which you can find mostly in older texts. Here’s an excerpt of one table (Stanford, n.d.) at the 5% alpha level (the most common significance level used):
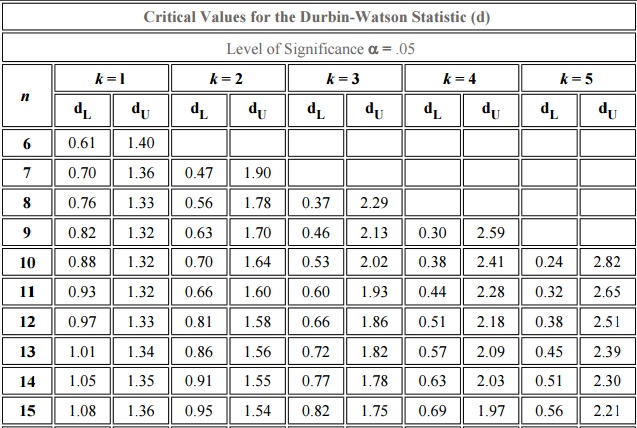
As the tables are so cumbersome, you’ll want to use technology to find the DW statistic.
Technology Options
- In Minitab:
Click Stat > Regression > Regression > Fit Regression Model. Click “Results,” and check the Durbin-Watson statistic. - SAS: Find directions here on the UCLA website.
- MATLAB: The procedure can be found here on the Mathworks site.
- SPSS: From the main regression dialog box, click Statistics. Check the box for Durbin-Watson (in the Residuals section of Linear Regression Statistics).
References
Beyer, W. H. CRC Standard Mathematical Tables, 31st ed. Boca Raton, FL: CRC Press, pp. 536 and 571, 2002.
Agresti A. (1990) Categorical Data Analysis. John Wiley and Sons, New York.
Dodge, Y. (2008). The Concise Encyclopedia of Statistics. Springer.
Field, A. [2009], Discovering statistics using SPSS, third edn, Sage Publications.
Vogt, W.P. (2005). Dictionary of Statistics & Methodology: A Nontechnical Guide for the Social Sciences. SAGE.
Stanford. DW Table retrieved Sep 16, 2020 from: http://web.stanford.edu/~clint/bench/dwcrit.htm