Process capability analysis is a set of tools used to find out how well a given process meets a set of specification limits. In other words, it measures how well a process performs.
In practice, it compares the distribution of sample values—representing the process outcome—to the specification limits, which are the limits of what we want achieved. Sometimes it compares to a specification target as well.
Process capability indices are usually used to describe the capability of a process. There are a number of different process capability indices, and whether you calculate one or all may depend on your analysis needs. But to calculate any process capability indices you assume stability of your process; for unstable processes process capability indices are meaningless. So a first step in process capability analysis is a check for stability throughout the process.
Probability Capability Indices
Cp stands for process capability, and is a simple measure of the capability of a process. It tells us how much potential the system has of meeting both upper and lower specification limits. Its weak point is that, in focusing on the data spread, it ignores the averages; so if the system being tested isn’t centered between the specification limits it may (when used alone) give misleading impressions. The narrower the spread of a systems output is, the greater the Cp value.
You can test how centered a system is by comparing Cp to Cpk. If a process is centered on its target, these two will be equal. The larger the difference between Cpk and Cp the more off-center your process is.
Cpk stands for process capability index and refers to the capability a particular process has of achieving output within certain specifications. In manufacturing, it describes the ability of a manufacturer to produce a product that meets the consumers expectations, within a tolerance zone. If Cpk is more than 1, the system has the potential to perform as well as required.
The equation for Cpk is [minimum(mean – LSL, USL – mean)] / (0.5*NT), where NT stands for natural tolerance, LSL for lower specification limit and USL for upper specification limit.
Pp stands for process performance. It is much the same as Cp, but unlike Cp it measures actual performance rather than potential. Like Cp, it measures spread, and is subject to the same weaknesses.
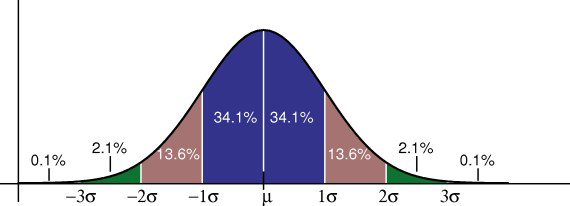
>Ppk stands for process performance index. Like Pp, it measures actual performance rather than potential. A Ppk of between 0 and 1 indicates that not all the processes outputs are meeting specifications. If Ppk is 1, 99.73% of your system’s output is within the specifications. The percentage 99.73% comes from the normal distribution curve, where 99.73% of results fall within -3 and 3 standard deviations from the mean.
These numbers, and a histogram representing them, are usually produced in a process capability analysis report.
References
NCSS Statistical Software. Chapter 255. Capability Analysis.
Retrieved from https://ncss-wpengine.netdna-ssl.com/wp-content/themes/ncss/pdf/Procedures/NCSS/Capability_Analysis.pdf on April 10, 2018
Statsoft Process Capability Analysis. Retrieved from
http://www.statsoft.com/Textbook/Statistical-Advisor/Process-Capability-Analysis on April 10, 2018.
Richman, Mike. Process Capability Analysis: Understanding how to estimate requirements and specification limits. Retrieved from https://www.qualitydigest.com/inside/statistics-article/process-capability-analysis-120417.html on April 10, 2018
PQ Systems, Quality Advisor: Capability Analysis
retrieved from http://www.pqsystems.com/qualityadvisor/DataAnalysisTools/capability_indices.php on April 12, 2018