This article is about Lin’s concordance correlation coefficient, which measures bivariate pairs of observations relative to a “gold standard” test or measurement. A similarly named statistic is the coefficient of concordance (often called the “W statistic“), which is used to assess agreement between different raters.
What is the Concordance Correlation Coefficient?
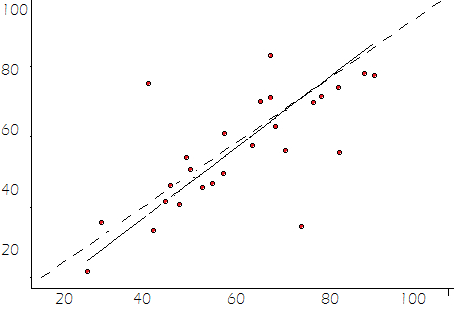
(ρc)measures both precision (ρ) and accuracy (Cβ).
- (ρ) = Pearson’s correlation coefficient,
- (CΒ) = Bias correction factor, a measure of how far a line of best fit (i.e. the line of perfect concordance) is from a 45 degree angle through the origin.
Interpretation
(ρc) ranges from 0 to ±1. Altman (1991) places the interpretation close to other correlation coefficients like Pearson’s, with <20 as “poor” and >80 as “excellent.” This interpretation is by no means set in stone; Other researchers have various interpretations. For example, McBride (2005) suggests the following guidelines for interpreting Lin’s concordance correlation coefficient:
- < 0.90: poor
- 0.90 to 0.95: moderate
- 0.95 to 0.99: substantial
- > 0.99 almost perfect.
What everyone does agree on is that near ±1 is perfect concordance (or perfect discordance) and 0 is no correlation; Everything in between should be interpreted with caution.
See also: Concordant and discordant pairs.
References:
Altman DG (1991) Practical statistics for medical research. London: Chapman and Hall.
Lin L.I-K (1989) A [CCC] to evaluate reproducibility. Biometrics 45:255-268
McBride GB (2005) A proposal for strength-of-agreement criteria for Lin’s concordance… NIWA Client Report: HAM2005-062.
Lin L (2000). A note on the concordance correlation coefficient. Biometrics 56: 324 – 325.