What is a Block Plot
A block plot helps you figure out what the most important factors in your experiment are, including interactions. A basic block plot will show if a factor is important. It will also show if that factor stays the same (i.e. if it is robust) for all settings of other factors.
Block plots can also assess statistical significance. Statistical significance is usually tested with ANOVA. However, ANOVA is based on the assumption of normality. Block plots don’t have this assumption, so they can be extremely useful for non-normal data.
Assessing the Relative Importance of Factors
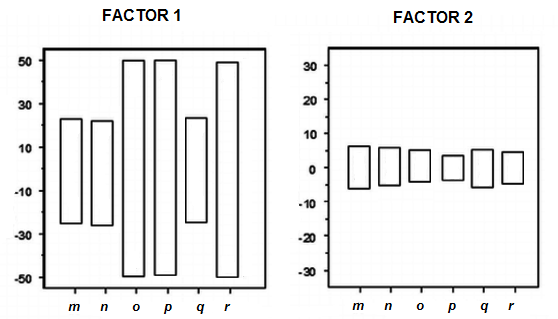
The vertical axis represents the response variable. The taller the bar, the more impact on the response variable, so the more important the factor. Where the blocks are relative to each other is not important. In the following box plots, all of the block heights in the factor 1 plot are taller than all of the block heights in the factor 2 plot. Therefore, primary factor 1 is more important than primary factor 2.
Assessing Statistical Significance
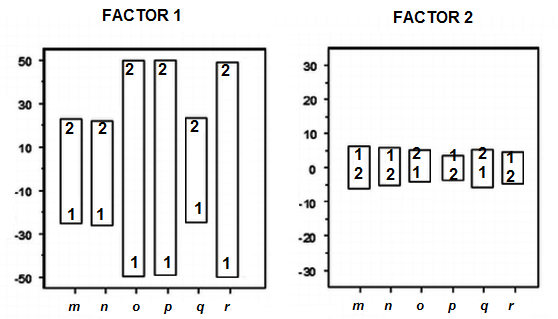
To assess how statistically significant each factor is, look at where each level falls within the bars. The characters inside each bar (these may be symbols, numbers or some other notation) represent the levels.
In the following plot for Factor 1, the response for level 2 is higher than the response for level 1 in each of the bars. The level ordering in plot 2 is inconsistent (sometimes 1 is above 2 and vice-versa), so factor 2 is not statistically significant.
To figure out if factor 1 is statistically significant, you first have to calculate the probability of that particular level ordering to happen. If you’re rusty on how to find probabilities, start here: What is the Probability of A and B.
There are only two ways the levels can be ordered (1 then 2 or 2 then 1). So the probability of one block being ordered 1 then 2 is ½. The probability of all six blocks showing 1 and then 2 is: ½ * ½ * ½ * ½ * ½ * ½ = 1/(26) = 1 / 64 = 0.02.
Finally, compare your probability to your chosen significance level. If the probability you calculate is less than the significance level, then that factor is significant. At a 5% significance level, this block ordering (and therefore Factor 1) is statistically significant.
Assessing Interactions
To assess interactions, look at whether the heights of the bars are changing in a systematic fashion. While the block plot for Factor 1 appears to be random, the blocks for Factor 2 seem to be decreasing steadily (up to a point), so this may warrant further attention.
References
Phillips, J. (2013). Digital Analytics Primer. Pearson Education.