Design of Experiments > Hazard Ratio Contents:
About hazard rates, ratios and functions
A hazard rate, also known as the failure rate, force of mortality, or the instantaneous event rate, is a measure of the likelihood that an event, such as failure or death, will occur at a specific point in time, given that it has not occurred yet. It is commonly used in survival analysis and reliability engineering to model the risk of failure over time.
Various methods, including survival analysis, can be used to estimate hazard rates from data. Survival analysis is a statistical technique that examines the time until an event occurs, such as the onset of a disease or death.
A similar concept is the hazard ratio, although they are not the same thing. Hazard rate is a measure of the risk of an event occurring at a specific time, while hazard ratio is a measure of the relative risk of an event occurring between two groups of people — such as a control group and a treatment group in a clinical trial.
While the hazard rate is the instantaneous rate of failure at a given time, the hazard function H(t) is the probability of failure in a small time interval, given that the individual has survived until that time.
Hazard rate definition
The hazard rate is defined as the probability of an event occurring in a small interval of time, given that the event has not yet occurred. It is often denoted by h(t), where t is the time of interest. For example, the hazard rate for death at age 75 might be 0.01, which means that there is a 1% chance of death in a year for a 65-year-old person.
The hazard rate h(t) can also be defined as the ratio of the probability density function f(t) to the survival function S(t) for a given time t:
h(t) = f(t) / S(t)
Here, f(t) represents the probability density of the event occurring at time t, and S(t) is the probability that the event has not occurred up until time t (also known as the survival probability).
In simpler terms, the hazard rate can be thought of as the “risk” of the event happening at a specific time, conditional on the event not having occurred earlier. It can vary over time, which means that the hazard rate can increase, decrease, or remain constant as time progresses.
The hazard rate is useful for determining the likelihood of an event happening within a specific time frame. But it can also be used for other purposes, such as to compare the risk of events between different groups of people. For example, the hazard rate for death from heart disease might be higher for men than for women.
What is a hazard ratio?

The hazard ratio is a comparison between the probability of events in a treatment group, compared to the probability of events in a control group. It’s used to see if patients receiving a treatment progress faster (or slower) than those not receiving treatment. As a formula, the hazard ratio, which can be defined as the relative risk of an event happening at time t, is: λ(t) / λ0.
- A hazard ratio of 3 means that three times the number of events are seen in the treatment group at any point in time. In other words, the treatment will cause the patient to progress three times as fast as patients in the control group. Any ratio above 1 generally means that the treatment group healed faster or had a slower time to an event.
- A hazard ratio of 1 means that both groups (treatment and control) are experiencing an equal number of events at any point in time.
- A hazard ratio of 0.333 tells you that the hazard rate in the treatment group is one third of that in the control group.
What the “event” is depends on the type of study. For example, it may be death, a cure, or another event–like a stroke. Hazard ratios can be used to:
- Show the relative risk of a complication (like developing a side effect from a drug) in treatment group vs. control group.
- Show whether a treatment shortens an illness duration.
- Show which individuals are more likely to experience an event first.
While a hazard ratio is similar to a relative risk ratio, it isn’t exactly the same. Let’s say a clinical trial investigated survival rates for two drugs (A and B). The reported hazard ratios and relative risk ratios were both 3.
- The relative risk ratio tells you that the risk of death is three times higher with drug A than with drug B over the entire period of the study (i.e. it’s cumulative).
- The hazard ratio tells you that the risk of death is three times higher with drug A than with drug B at any particular point in time.
When evaluating hazard ratios, it’s recommended that you also use another measure such as median survival time, overall survival, or time to progression. These factors can provide insights about clear benefits (i.e. survival time is increased on average by 180 days).
Hazard log
Logarithmic transformation is often used in survival analysis to adjust a certain variable for covariates, decrease the effects of outliers and make the data more like a normal distribution (which makes it easier to analyze). As a formula, the hazard function (i.e. the risk of a certain event at time t), can be expressed in terms of the log of the hazard (Abramson & Abramson, 2001):
Log of hazard = log(a) + b1x1…+ bkxk
The model is additive with respect to the hazard log, as demonstrated by the formula; this means that the log of the hazard ratio can be transformed to the hazard ratio using exponents. The model is also multiplicative, with respect to the hazard. “Log of the hazard”, or “hazard log” could also be short for natural log of the hazard ratio itself (i.e. the hazard function divided by the baseline hazard function at time t): 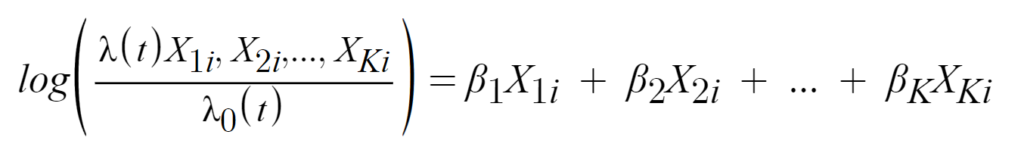
The above formula is a combination of parameters and regressors.
References
- W.carter, CC BY-SA 4.0, via Wikimedia Commons