Types of Variable > Dependent Variable Definition
Contents (click to skip to the section):
- Dependent Variable General Definition.
- Dependent Variable Examples.
- Test Your Understanding.
- Dependent Variable Definition (Statistical Modeling).
- Dependent Variables in Psychology.
- Dependent Variables in Cross Tabs.
- Other Names for the Dependent Variable.
- Outcome Variable.
Dependent Variable Definition.
The dependent variable(DV) is just like the name sounds; it depends upon some factor that you, the researcher, controls. For example:
- How well you perform in a race depends on your training.
- How much you weigh depends on your diet.
- How much you earn depends upon the number of hours you work.
Whatever event you are expecting to change is always the dependent variable. In the first example above race performance is the variable you would expect to change if you changed your training, so that’s the dependent variable. In the second example, the dependent variable is weight and in the third example the dependent variable is the amount earned.
If you have trouble figuring out which of your variables is the independent one, and which is the dependent one, try inserting the variables into the following sentence:
“(Independent variable) causes a change in (Dependent Variable) and it isn’t possible that (Dependent Variable) could cause a change in (Independent Variable).”
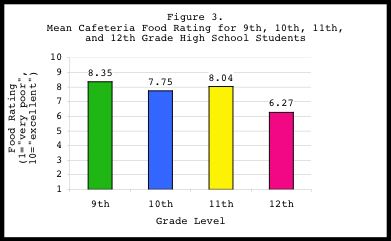
When you run an experiment (I’m using the word “experiment” here loosely…it could be as simple as taking a survey or it could involve a complex scientific experiment), your independent variable stays fixed. In the next graph, the independent variable(IV) is the grade level and the dependent variable is the food rating. You can see that the food rating depends on what grade a student is (it looks like the higher grade levels have pickier eaters or perhaps students who choose their food more carefully).
Potential Confusion
You, the researcher, define your variables when you set up your experiment. Your hypothesis statement is what determines whether a variable is dependent or independent. Any variable can be and independent variable(IV) or dependent variable(DV). For example, let’s say you are interested in studying the health benefits of walking. You write the following two hypothesis statements:
- A more nutritious diet leads to more daily walking.
- More daily walking leads to increased happiness.
Both of the statements above are valid (assuming they correctly describe what you are trying to test with your experiment). However, walking is the DV in statement 1 and the IV in statement 2.
Example: The Brain as both Dependent and Independent Variables
Much research has been conducted in the past that treats the brain as an IV. For example, the brain has a direct effect on behavior. However, more recent research has shown that the brain can also be a DV. for example, biofeedback is a type of learned behavior that helps you to control stress responses, like heart rate and muscle tension. The behavior makes subtle (and possibly permanent) changes in the brain. With biofeedback, the brain is the dependent variable, as it depends upon the behaviors practiced during biofeedback sessions. Although this is another example of how confusing the definition of an IV or DV can be, it also highlights how important it is to craft a good hypothesis statement for your experiment. Remember: the outcome of your experiment (i.e. your dependent variable) depends on how well you craft your hypothesis statement!
Dependent Variable Examples.
Example 1: A study finds that reading levels are affected by whether a person is born in the U.S. or in a foreign country. The IV is where the person was born and the DV is their reading level. The reading level depends on where the person was born.
Example 2: “In nonexperimental research, where there is no experimental manipulation, the IV is the variable that ‘logically’ has some effect on a DV. For example, in the research on cigarette-smoking and lung cancer, cigarette-smoking, which has already been done by many subjects, is the independent variable.” (Kerlinger, 1986, p.32) Lung cancer “depends” on smoking.
Tip: If you have trouble figuring out which of your variables is the independent one, and which is the dependent one, try inserting the variables into the following sentence:
“(Independent variable) causes a change in (Dependent Variable) and it isn’t possible that (Dependent Variable) could cause a change in (Independent Variable).”
Taking the two examples above, see how illogical it sounds to switch the places of the IV and DV in the bolded statements:
- Where a person is born depends on their reading level.
- Smoking “depends” on lung cancer.
Like most things in life though, if only it was that easy. Sometimes, it doesn’t work just to switch the phrase around to see if it works or not. Take the following two examples:
Example 3: A researcher studies how different drug doses affect the progression of a disease and compares the intensity and frequency of symptoms when different doses are given. The IV is the dose given and the DV is the intensity and frequency of symptoms. The intensity and frequency of symptoms “depends” on the dose of drug given.
Example 4: You are studying how tutoring affects SAT scores. Your independent variable(IV) is tutoring and the dependent variable(DV) is test scores. The test scores “depend” on the tutoring.
Switching them around also (sort of) makes sense:
- Dose of drug given depends on the intensity and frequency of symptoms.
- Tutoring depends on test scores.
That said, if you know what the hypothesis statement is–in other words, you know what is being tested–then you can decide which of the two versions make sense. This is one reason why it’s vital to craft a very clear hypothesis statement.
Dependent Variable Definition (Statistical Modeling)
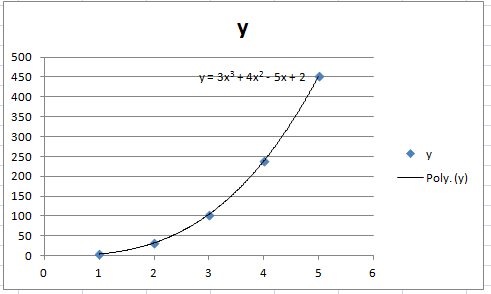
Statistical modeling is where you develop a model that fits a set of observed data. The definition for the dependent variable(DV) in statistical modeling is essentially the same basic definition as the one used in general math and science: it’s a variable that “depends” on the independent variable(IV). However, instead of a hypothesis statement, you have a model that contains both variables. The DV represents the model’s output or outcome that you are studying. It is usually given the letter “y” and is traditionally graphed on the y-axis. The IV represents the potential causes for variation in the model. It is usually given the letter “x” and is graphed on the x-axis.
The dependent variable is also called a response variable or endogenous variable in statistical modeling.
Test Your Understanding.
For each question, choose the dependent variable. A tip for completing this quiz is first choose the two main variables from the statement. Then figure out which one is the DV (it’s the one that depends on the other one).
Q1: You are conducting an experiment to see if exposure to more sunlight increases happiness levels for workers who typically spend the entire day in windowless offices.
- Sunlight.
- Happiness level.
- Windowless offices.
- Time of day.
Click here for the answer.
Q2: An experiment in a climate-controlled greenhouse concludes that water level, fertilizer and nutrient level in soil affects how tall plants grow. Plants grew an average of 12″ taller if treated with optimal resources.
- The greenhouse.
- Water level, fertilizer and nutrient levels.
- How tall the plants grow.
- Optimal resources.
Q3: A researcher suspects that a cholera outbreak is happening because of tainted wells in the city. Most of the cases are clustered around public wells that draw their water from the underground aquifer.
- The underground aquifer.
- Cholera.
- Wells.
- The City.
Q4: Studies have shown that condom use is effective in controlling the spread of HIV. However, studies also show that a combination of two HIV medications (tenofovir and emtricitabine) can also control the spread of the disease.
- Tenofovir.
- Emtricitabine.
- Both 1 and 2.
- HIV.
Click here for the answer.

Solution to Q1:
Q1: The correct answer is 2, happiness level. Happiness levels depend upon the amount of sunlight. If you try any of the other combinations, none make sense in the statement “x depends on y.” For example, “sunlight depends on happiness” doesn’t make a whole lot of sense. Plus, the clue was in the hypothesis statement itself (exposure to more sunlight increases happiness). Back to Quiz.
Solution to Q2:
Q2: The correct answer is 3, how tall the plants grow (how tall the plants grow depends on the resources used). Back to Quiz.
Solution to Q3:
Q3: The correct answer is 2, cholera. The cholera outbreak depends upon (i.e. is a result of) the polluted water supply from the aquifer. Back to Quiz.
Solution to Q4:
Q4: The correct answer is 4, HIV. Controlling the spread of HIV depends upon condom use and the medications listed.Back to Quiz.
Dependent Variables in Psychology.
“In psychology studies, the dependent variable is usually a measurement of some aspect of the participants’ behavior. The IV is called independent because it is free to be varied by the experimenter. The DV is called dependent because it is thought to depend (at least in part) on the manipulations of the IV.” (Weiten, 2013)
Put another way, the dependent variable is the variable that is being measured by you, the experimenter. In psychology, the DV is often a score of some type. For example, a score on memorization task, an IQ test, or a depression scale.
Multiple Dependent Variables.
It’s common in psychology to investigate multiple dependent variables at the same time. Research can be a difficult process to set up–from gathering participants to obtaining funding and permissions–so making your research as broad as possible has many benefits. Researchers Simone Schnall and colleagues investigated how feeling disgust affected the harshness level of people’s moral judgment. The harshness of moral judgment was the DV, but several other DVs were measured, like how disgust affected people’s willingness to dine at a restaurant.
Dependent Variables in Contingency Tables.
A contingency table is a way to summarize the relationship between several categorical variables. The word “contingency” here means the same as “dependent,” so what the table does is organize your dependent data. With contingency tables, the DV is usually placed in rows and the IV is usually placed in columns.
For example, let’s say you were investigating how health is affected by age, socioeconomic status, or heart disease. The independent variables (i.e. age 0-18, 18-64, 65+) are placed in the columns. Health (perhaps measured on a scale from 1 to 10 with 10 being the best) is placed in the rows. Placing your data using this standardized format makes it easier to interpret results.
Other Names for the Dependent Variable.
A dependent variable is also called:
- An experimental variable.
- An explained variable.
- A measured variable.
- An outcome variable.
- An output variable.
- A responding variable.
- A regressand (in regression analysis.)
- A response variable.
Outcome variable.

What is an Outcome variable?
The outcome variable and dependent variable are used synonymously. However, they are not exactly the same: the outcome variable is defined as the presumed effect in a non-experimental study, where the dependent variable is the presumed effect in an experimental study1.
Experimental vs. Non-experimental Studies.
In an experimental study, the researcher controls the allocation of resources to study participants. A non-experimental study is more like an observational study; the researcher takes a look at what the participants are exposed to and then categorizes the individuals based on those exposures. Data registries and case studies are two examples of non-experimental; studies.
A simple example: let’s say you were interested on whether snack foods improved test scores. In an experimental study you could separate students into two groups, feed one group snacks while taking a test and deny the other group (the control group) access to food. In the non-experimental case, you would find a group of students (say, in an entire college) and separate the students into those who eat snacks during a test and those who do not. You could then observe their performance on a test.
Measuring the Outcome Variable.
As outcome variables are involved in non-experimental studies, it’s practically impossible to put a numeric value on an outcome. Instead, non-numeric techniques are used2:
- Expert opinion.
- One or more case reports.
- Program evaluations. These are studies designed to see whether a program is meeting its goals.
- Quality improvement methods (Plan-Do-Study-Act), used to measure or redefine standards.
- Case control studies; performed after an event has happened. Data is gathered and the researcher attempts to find the cause based on this historical data.
- Cohort studies: similar to case control but the participants are gathered before any event has happened. For example, a group of 1,000 people age 40-50 might be studied for 10 years to see who develops heart disease.
References:
1. Indiana University: Types of Variables.
2. Measuring Outcomes in Speech-language Pathology By Carol Frattali.
3. Kerlinger, F. N. (1986). Foundations of behavioral research (3rd ed.). Fort Worth: Holt,Rinehart and Winston, Inc.
4. Weiten, W. (2013). Psychology: Themes and variations, 9th ed. Belmont, CA: Wadsworth.