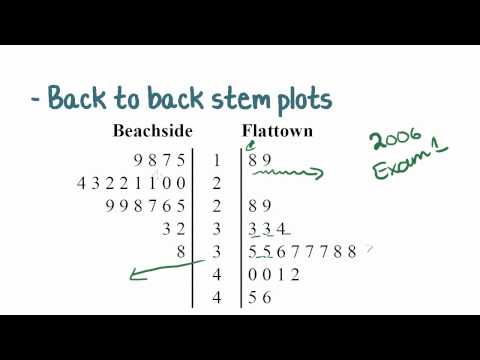
A back to back stemplot is a graphical way to display statistical data.
What is a Stemplot?
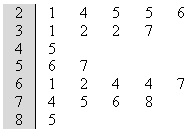
A stemplot is similar to a histogram—it is a tool to help you visualize the shape of a distribution. They have been a common tool for displaying data since the 1970s. With a regular stemplot, there is one “stem” to the left (shaded in gray) and one “leaf” to the right.
What is a Back to Back Stemplot?
Back to back stemplots have two leaves that share a single stem. The stem is shaded gray in the following picture.
When would I use a Back to Back Stemplot?
You would use a back to back stemplot when you are comparing quantitative (numerical) data to two sets of categorical variables. For example, you might be comparing weights of pregnant women (numerical data) in the second and third trimesters (second and third trimesters are the categorical portions of the plot). You have two categories (women in the second trimester and women in the third trimester) and you have measured their weights (the quantitative data).
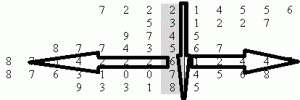
Plotting a back to back stemplot
The leaf goes in the center, with numbers running from least (at the top) to highest (at the bottom). Numbers in the right leaf run lowest to highest, with the lowest number placed closest to the stem. The data on the left side of the stem runs in the opposite direction (like a mirror) with the numbers running from lowest to highest starting at the stem.
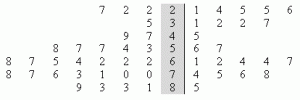
Split back to back stemplot
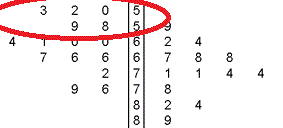
Sometimes, you might have too many pieces of data in one or two categories. An option is to split the categorical data into two. The back to back stemplot shown below is an example of a split back to back stemplot. It is called a split stemplot because each category is split into two. For example, if you look at the stem (in the center), the number “5” appears twice. The numbers 0-5 in the leaf are in the first, or upper, row and the numbers 8 to 9 are in the second, or lower, row.
Check out our YouTube channel for more stats tips and help!
References
Everitt, B. S.; Skrondal, A. (2010), The Cambridge Dictionary of Statistics, Cambridge University Press.