A U Chart is a type of attribute control chart used to control the mean number of defects in samples of differing sizes taken from a process. It is used when:
- Product characteristics can be evaluated with a discrete response: good/bad, pass/fail, or yes/no.
- You have more than 25 samples (ideally 30 – 100+).
- The probability of at least one defect per subgroup is large, but the actual number of defects is small.
This type of chart is one way to visualize if a measurement process has deviated from statistical control. In other words, it’s a way to track defects per inspection unit.
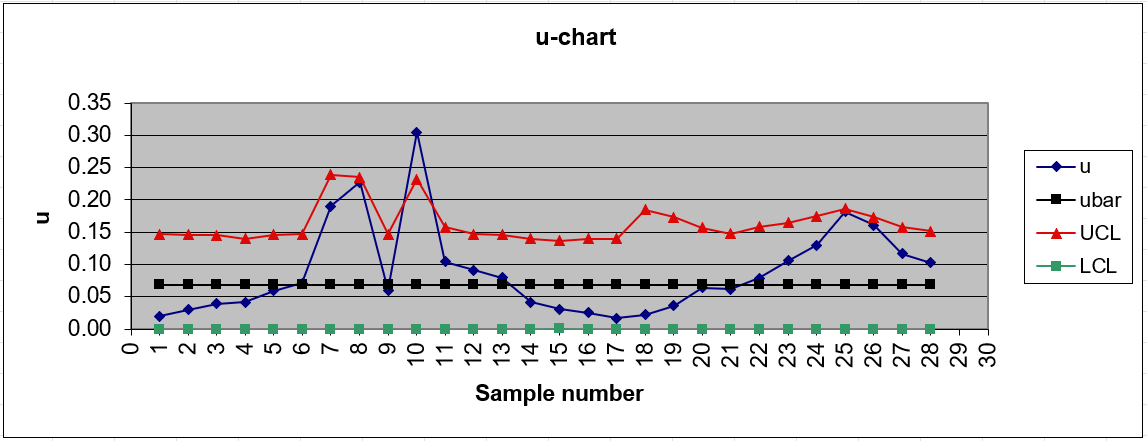
The “U” in U Chart is short for units, meaning “defective units per lot” [1].
The C chart plots the total number of defects per unit while the U chart plots the average number of defects per unit. The U chart is more useful when subgroup sizes are different [2].
Creating the U Chart
The U chart (along with the c Chart) is based on the Poisson distribution. The first step is to choose the size of one inspection unit, which should be large enough that at least one defect will probably occur. Units can be one item (like a widget), multiple items (such as 100 units), or an area (e.g., a square meter). You’ll also want to choose a sampling frequency, or how often you’ll be collecting data.
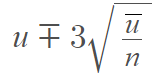
The formulas used to create the U chart are as follows [3]:
- Average number of defects (i.e. the centerline of the chart):
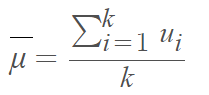
Where “k” is the number of samples or subgroups to be collected before control limits are calculated (at least 25). - Upper Control Limit and Lower Control Limits:

This U Chart_template allows you to enter your own data to create a U chart in Excel [4].
References
[1] U Control Chart. Retrieved December 10, 2021 from: https://citeseerx.ist.psu.edu/viewdoc/download?doi=10.1.1.218.1422&rep=rep1&type=pdf
[2] Attribute Control Charts. Retrieved December 10, 2021 from: https://aaq.auburn.edu/node/9988/take
[3] The u-Chart. Retrieved December 10, 2021 from: https://www.shsu.edu/~mgt_ves/mgt481/lesson7/sld026.htm
[4] uChart Template. Retrieved December 10, 2021 from: https://web.njit.edu/~mr244/uChart_templ.xls