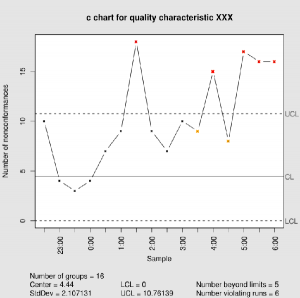
A c chart is a type of control chart that shows how many defects or nonconformities are in samples of constant size, taken from a process (Misra, 2008).

Formulas
The c chart formulas are (Doty, 1996):
- Number of defects per unit c = Σc / Σn = Σc / m
- Upper control limit (UCL) = c + 3√c
- Lower control limit (LCL) = c – 3√c
Where:
- Σ is summation notation,
- n is the sample size,
- m is the number of subgroups.
U Chart vs C Chart
Both the u chart and the c chart are used to control defects, and the two charts differ only slightly; The c chart controls actual number of defects per unit, while the u chart controls the average number of defects per unit. The formulas for creating the two charts are identical, except with a c chart that there’s no need to divide by the total number of items in the sample, n .
A c chart can only be used if the sample size remains constant. If sample sizes aren’t constant, use a u chart instead (Misra, 2008). Theoretically, a p chart doesn’t require a fixed sample size either, but those charts have a different purpose (p charts show proportions and are only used for “pass/fail” inspection).
References
“Counts Control Charts”. NIST/Sematech Engineering Statistics Handbook. National Institute of Standards and Technology. Retrieved June 15, 2020.
Doty, L. Statistical Process Control. 1996. Industrial Press.
Misra, K. Handbook of Performability Engineering, 2008. Springer.
C Chart by DanielPenfield / CC BY-SA (https://creativecommons.org/licenses/by-sa/3.0).
Montgomery, D. Introduction to Statistical Quality Control. Hoboken, New Jersey: John Wiley & Sons, Inc. p. 289. ISBN 978-0-471-65631-9.