What is a Two Way Table?
A two way table is a way to display frequencies or relative frequencies for two categorical variables. One category is represented by rows and a second category is represented by columns.
Example
Sixty people (30 men and 30 women) were asked what type of movie they would prefer to watch and the following responses were recorded:
- 6 men preferred rom-coms.
- 16 men preferred action movies.
- 8 men preferred horror movies.
- 12 women preferred rom-coms.
- 14 women preferred action movies.
- 4 women preferred horror movies.
The information collected was used to build the following two way table:
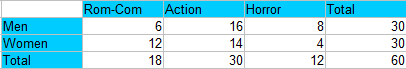
The entries in the table are counts; this type of table is called a two way frequency table. The table has several features:
- Categories are labeled in the left column and top row.
- The counts are placed in the center of the table.
- Totals appear at the end of each row and column.
- A sum of all counts (a grand total) is placed at the bottom right.
- The totals in the right column and bottom row are called marginal distributions (excluding the grand total).
- The entries in the center of the table (everything except the marginal distributions) are called joint frequencies.
Two Way Relative Frequency Table
Instead of displaying counts in the table, you could show relative frequencies. This is the same two way relative frequency table (decimals, percents, or ratios) displayed instead of counts:
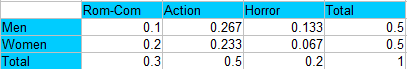
To convert counts into relative frequencies, divide the count by the total number of items. In the above table, the first count is for men / Rom-com (count=6), so 6/60 = 0.1.
The totals in the right column and bottom row are, like the two way frequency table, called marginal distributions. However, the entries in the center of the table are called conditional frequencies or conditional distributions.
Two way frequency tables are sometimes called contingency tables, but that term is usually only used once you get into more advanced statistics that involves research and hypothesis testing.
Check out our YouTube channel for hundreds of elementary statistics and probability how-to videos!
References
Agresti A. (1990) Categorical Data Analysis. John Wiley and Sons, New York.
Kotz, S.; et al., eds. (2006), Encyclopedia of Statistical Sciences, Wiley.
Levine, D. (2014). Even You Can Learn Statistics and Analytics: An Easy to Understand Guide to Statistics and Analytics 3rd Edition. Pearson FT Press