Statistics Definitions > Relative Variance
What is the Relative Variance?
The relative variance (RV) is a measure of error, or how much the “noise” of a data point or set of data points can vary. RV doesn’t have a universal definition, and it isn’t used very often in statistics except in very informal terms. Different definitions include (in no particular order):
Definition 1
The relative variance is the variance, divided by the absolute value of the mean (s2/|x̄|). You can also multiply the result by 100 to get the percent RV. Note: the two terms relative variance and percent relative variance are sometimes used interchangeably.
Definition 2
This one makes the most sense to me personally, although I’m sure other opinions differ. Hermance (2013) defines the RV in terms of rainfall. The variance of rainfall at a certain station is composed of three different variances. The RV is used to “…define the effect that the variability of rainfall for a given month has on the variability of the rainfall over the entire season for the station.” It’s a relatively simple definition, with this formula (where sd = standard deviation):

Definition 3
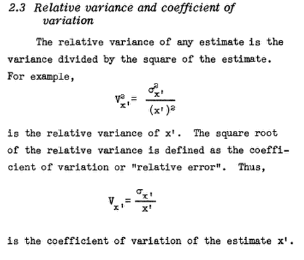
I found a single reference to another (very similar) formula, in a U.S. Department of Commerce publication, which defined RV as “the variance divided by the square of the estimate.”

The last part might be a lesson in how many definitions for can become confusing. It reads that the “…square root of the RV is defined as the coefficient of variation“.
- By this definition, the square of the coefficient of variation must equal the RV squared.
- The coefficient of variation is defined as the standard deviation divided by the mean.
- Therefore, the variance divided by the square of the estimate — squared, should equal the standard deviation divided by the mean
.
This doesn’t equate, so be careful when you’re using the RV as a calculation.
I’ve also seen RV calculated as:
- The square root of the variance divided by the mean:
- The standard deviation divided by the mean.
- A constant multiplied by a diameter, divided by a weight (here).
In sum, there isn’t a standard formula, so be very careful if using this statistic — you may end up confusing your readership.
References:
Hermance, J. (2013). Historical Variability of Rainfall in the African East Sahel of Sudan: Implications for Development. Springer Science & Business Media.
Poole, C. et. al. (2001). Relative thin-layer chromatography, a practical survey. P. 318.
Relative Var. Dataplot reference manual. September 3, 1996.
U.S. Dept. of Commerce. (1968). Agrostan: A Case Study for the 1970 World Census of Agriculture, Volume 3
willhelm-Welmer, F. (2012). Statistical Evaluations in Exploration for Mineral Deposits. Springer Science & Business Media.