The proportion variance is a measure of dispersion in a proportion. Variance of a sample proportion is given by the formula [1]:
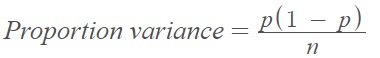
Where:
- p = true proportion of population individuals with the property.
- n = sample size.
Proportion Variance in Factor Analysis
The proportion variance is the variance in all variables that is accounted for by a single factor. In other words [2],
Eigenvalue / number of variables = Proportion Variance.
The higher the sum of square (SS) loadings (i.e., the eigenvalue), the more the factor is helping to explain the variances in the variables. According to the Kaiser Rule, a rule of thumb for interpreting the usefulness of factors, a factor is important if its eigenvalue is greater than 1.
The eta-squared is one measure of the proportion of variance explained in a dependent variable. It is usually group differences of a categorical independent variable; In MANOVA, it is the proportion of the total variability in the dependent variables that is attributable to a given main effect or interaction [3].
Proportion Variance in the Standard Error Formula
The proportion variance, p * (1 – p), appears in the standard error formula:
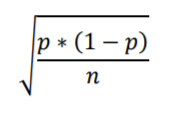
As the proportion, p, moves from 0.5 to zero or 1, the proportion variance decreases:
- 0.0 * (1 – 0) = 0.00
- .01 * (1 – .01) = .01
- .1 *(1 – .1) = .09
- .3 *(1 – .3) = .21
- .5 *(1 – .5) = .25
- .7 *(1 – .7) = .21
- .9 *(1 – .9) = .09
- .99 *(1 – .99) = .01
- 1.0 *(1 – 1) = 0.00
This means that standard error will also decrease, because the variance is in the numerator.
References
[1] Krishnamurty, G. et al. (1995). Statistics: An Interactive Text for the Health and Life Sciences. Jones and Bartlett.
[2] Exploratory Factor Analysis – Basic.
[3] Neuendorf. MANOVA /MANCOVA.