Excel for Statistics > Two Way ANOVA in Excel
Contents:
Two Way ANOVA in Excel with Replication
 ANOVA tests are used to determine whether you have significant results from tests (or surveys). A two way ANOVA with replication is performed when you have two modalities with several levels of the independent variable. For example, you might have group counseling and individual counseling, with symptoms of stress, depression and anxiety as levels. You would measure the levels of independent variable with the same instrument.
Two Way ANOVA in Excel with replication: Steps
Step 1: Click the “Data” tab and then click “Data Analysis.” If you don’t see the Data analysis option, install the Data Analysis Toolpak.
Step 2: Click “ANOVA two factor with replication” and then click “OK.” The two way ANOVA window will open.
Step 3: Type an Input Range into the Input Range box. For example, if your data is in cells A1 to A25, type “A1:A25” into the Input Range box. Make sure you include all of your data, including headers and group names.
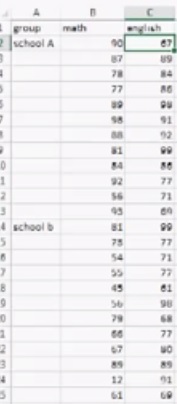
Step 4: Type a number in the “Rows per sample” box. Rows per sample is actually a bit misleading. What this is asking you is how many individuals are in each group. For example, if you have 12 individuals in a group taking two tests (as in the picture below) you would type “12” into the Rows per Sample box.
Step 5: Select an Output Range. For example, click the “new worksheet” radio button to display the data in a new worksheet.
Step 6: Select an alpha level. In most cases, an alpha level of 0.05 (5 percent) works for most tests.
Step 7: Click “OK” to run the two way ANOVA. The data will be returned where you specified in Step 5.
Step 8: Read the results. To figure out if you are going to reject the null hypothesis or not, you’ll basically be looking at two factors:
- 1. If the F-value ( f )is larger than the f critical value ( f crit )
- If the p-value is smaller than your chosen alpha level.
That’s it!
Tip: You don’t only have to have two variables to run a two-way ANOVA in Excel 2013. You can also use the same function for three variables, four, five…etc.
Two Way ANOVA in Excel without Replication
Two Way ANOVA in Excel without Replication: Overview
Two population testing in statistics can be performed using an ANOVA (Analysis of Variance) test. While the t-test compares means, ANOVA compares the variance between the populations. A Two way ANOVA in Excel without replication can compare a group of individuals performing more than one task. For example, you could compare students’ scores across a battery of tests. If you have more than one group (say, from two different colleges), use the two way ANOVA in Excel WITH replication.
Two Way ANOVA in Excel without Replication: Steps
Step 1: Click the “Data” tab in the ribbon and then click “Data Analysis.” Install the Data Analysis Toolpak if you don’t see Data Analysis as an option.
Step 2: Click “ANOVA two factor without replication” and then click “OK.”
Step 3: Type the location for your data into the Input Range box. For example, type “A2:C30” if your data is in cells A2 through C30. Make sure to include the location of your headers and group/individual names, not just the raw data.
Step 4: Choose an Output Range. For example, select an area to the right of your data to display the ANOVA output.
Step 5: Choose an alpha level. In most cases, you can leave the default (0.05).
Step 6: Click “OK.”
Step 7: Analyze the results from the ANOVA output. The two most important factors in using ANOVA to accept or reject the null hypothesis are:
- Is the F-value ( f )larger than the f critical value ( f crit )? If so, there is a statistical significance to the results, leading you to reject the null hypothesis.
- Is the p-value smaller than your chosen alpha level? If so, that would also lead you to reject the null hypothesis.
That’s it!
Tip: You don’t only have to have two variables to run a two-way ANOVA without replication in Excel 2013. The same function would work for more variables (3,4,5, etc.).
Check out our YouTube channel for more Excel tips and help!
References
Agresti A. (1990) Categorical Data Analysis. John Wiley and Sons, New York.
Dodge, Y. (2008). The Concise Encyclopedia of Statistics. Springer.
Klein, G. (2013). The Cartoon Introduction to Statistics. Hill & Wamg.
Kotz, S.; et al., eds. (2006), Encyclopedia of Statistical Sciences, Wiley.