 A Lorenz curve is a graph used in economics to show inequality in income spread or wealth. It was developed by Max Lorenz in 1905, and is primarily used in economics. However, it may also be used to show inequality in other systems. The Gini index can be calculated from a Lorenz curve by taking the integral of the curve and subtracting from 0.5.
Reading a Lorenz curve
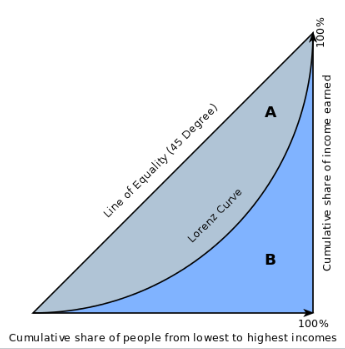
The x-axis on a Lorenz curve typically shows the portion or percentage of the total population, and the y-axis shows the portion of total income/ wealth, or whatever is being analyzed.
Since perfect equality would mean that a 1/k portion of the population controlled 1/k of the wealth, perfect equality on this graph would be shown by a straight line with a slope of 1. This line is often drawn on the graph as a point of reference, alongside the curved line which represents the actual wealth/income/size distribution. The further away from the 1/1 baseline a particular curve is, the more pronounced the inequality.
Any point on the curve can be read to tell us what percentage or portion of the population command what percent of the wealth, income, or whatever variable is being studied. For instance, if the Lorenz curve representing income in a particular town crossed the point 0.57, 0.23 we would know that 0.57 of the population commanded just 0.23 of the town’s income. In an completely equal situation, of course, 0.57 of the population would earn 0..57 of the total income, and the Lorenz curve would be identical to the 45 degree 1/1 line.
Both x and y axes are from 0 to 1, which can be expressed as a percentile (1 to 100 %) as shown in the above graph. The axes can also show quartiles.
Graphing a Lorenz Curve
To graph a Lorenz curve, the response variable (usually income or wealth) is first indexed in either equal or increasing order. Then points are graphed for a continuous distribution. If n is the number of instances of the response variable, then the ith x-coordinate will be i/n. The y-coordinate will be where YK are the response variables.

References
- Damgaard, Christian. Lorenz. From MathWorld–A Wolfram Web Resource, created by Eric W. Weisstein. Retrieved from http://mathworld.wolfram.com/LorenzCurve.html on July 14, 2018
- Gastwirth, Joseph. A General Definition of the Lorenz Curve. Econometrica
Vol. 39, No. 6 (Nov., 1971), pp. 1037-1039. Retrieved from https://www.jstor.org/stable/1909675 on July 15, 2018. - NIST. Lorenz Curve. NIST Statistical Engineering Division Dataplot Reference Manual 1. Retrieved from https://www.itl.nist.gov/div898/software/dataplot/refman1/auxillar/lorenz.htm on July 14, 2018.