Contents:
Overview of Ripley’s K-Function
The K-Function (also called Ripley’s K-function or the network K-Function) is a way to analyze completely mapped event location data (i.e. the locations of all events from a study).
The function is generally used to find out if the phenomenon of interest (e.g. trees,) is clustered, dispersed, or randomly distributed throughout the area of interest. Other uses include:
- Estimating parameters. A parameter is the actual figure from the whole population.
- Fit a model to the data. For example, your data might fit a linear function.
- Perform a hypothesis test about the pattern. Hypothesis tests are common in calculus-based statistics, where you have to “prove” your results are valid with a test.
- Summarize a pattern of points.
In general, the K-function is a summary of how observed distances between similar events are clustered or dispersed. If the events are clustered, it tells you the distance where the clustering occurs. It was originally developed by Ripley in 1976.
A comparison of observed vs. expected distances give you the following information:
- If the observed value is higher than the expected value, the events tend to cluster.
- f the observed value is lower than the expected value, the events are dispersed.
Formal Definition of Ripley’s K-Function
The K-function is denoted as:
K(t) = λ-1 E,
Where:
“E” = the number of additional events within distance t of a random event.
Formally, the K-Function is defined as:
![]()
Where:
- R = region of interest,
- s = distance,
- dij = distance between the ith and jth events,
- Is(dij = An indicator function. If dij ≤ s, it equals 1. It equals zero for all other values.
The function gives the expected number of events within distance of a randomly chosen event.
Limitation
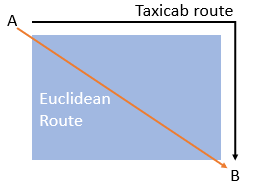
Although useful, the function has one very limiting assumption: points are assumed to be continuous on a Euclidean plane. This could be problematic if you’re analyzing data that isn’t on a Euclidean plane.
As an example, let’s say you’re analyzing traffic flow for a busy New York intersection. The points here might be “cars”, and their distances can all be expressed in Euclidean terms: Left, Right, Up, Down (relative to the intersection). However, let’s say your study extended to several city blocks. A car doesn’t travel straight to the next block through building: it takes the only route available: along streets. Those distances are non-Euclidean (i.e. they belong to a type of geometry called Taxicab geometry).
References
Dixon, P. (2002). Ripley’s K-Function. In Encyclopedia of Environmetrics. Volume 3, pp 1796-1803. Retrieved November 28 from: https://www3.nd.edu/~mhaenggi/ee87021/Dixon-K-Function.pdf
Gelfand, A. et al. (2010). Handbook of Spatial Statistics.
Popovich, V. et al. (2015). Information Fusion and Geographic Information Systems (IF&GIS’ 2015): Deep Virtualization for Mobile GIS. Springer.
Ripley, B.D. (1976). The second-order analysis of stationary point processes, Journal of Applied Probability
13, 255–266.