Correlation Coefficients >
Intraclass Correlation
Intraclass Correlation
Intraclass correlation measures the reliability of ratings or measurements for clusters — data that has been collected as groups or sorted into groups. A related term is interclass correlation, which is usually another name for Pearson correlation (other statistics can be used, like Cohen’s kappa, but this is rare). Pearson’s is usually used for inter-rater reliability when you only have one or two meaningful pairs from one or two raters. For more, you’ll want to use the ICC. Like most correlation coefficients, the ICC ranges from 0 to 1.
- A high Intraclass Correlation Coefficient (ICC) close to 1 indicates high similarity between values from the same group.
- A low ICC close to zero means that values from the same group are not similar.
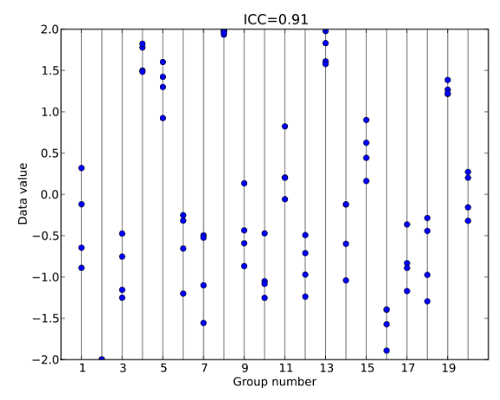
This is best illustrated with an example. In the image below, values from the same group are clustered fairly tightly together. For example, group 3 (on the x-axis) is clustered between about -1.3 and -0.4 on the y-axis. Most of the groups are similarly clustered, giving the entire set a high ICC of 0.91:
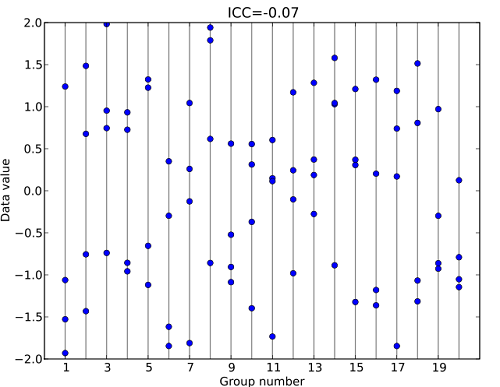
Compare that set to the following graph of a dataset with an extremely low ICC of 0.07. The values within groups are widely scattered without any clusters:
Common Uses and Calculation
The ICC is used to measure a wide variety of numerical data from clusters or groups, including:
- How closely relatives resemble each other with regard to a certain characteristic or traits.
- Reproducibility of numerical measurements made by different people measuring the same thing.
Calculating the ICC is very complex by hand, in part because of the number of ICC formulas to choose from, and partly because the formulas themselves are complex. The main reason for all of this complexity is that the ICC is very flexible and can be adjusted for inconsistent raters for all ratees. For example, let’s say you have a group of 10 raters who rate 20 ratees. If 9 of the raters rate 15 of the ratees and 1 rater rates all of them, or if 10 raters rate 2 each, you can still calculate the ICC.
Calculating the ICC is usually performed with software, and each program has its own terminology and quirks. For example, in SPSS, you’re given three different options for calculating the ICC.
- If you have inconsistent raters/ratees, use “One-Way Random.”
- If you have consistent raters/ratees (e.g. 10 raters each rate 10 ratees), and you have sample data. use “Two-Way Random.”
- If you have consistent raters/ratees (e.g. 10 raters each rate 10 ratees), and you have population data, use “Two-Way Random.”