Design of Experiments > Inter-rater Reliability
What is Inter-rater Reliability?
Inter-rater reliability is the level of agreement between raters or judges. If everyone agrees, IRR is 1 (or 100%) and if everyone disagrees, IRR is 0 (0%). Several methods exist for calculating IRR, from the simple (e.g. percent agreement) to the more complex (e.g. Cohen’s Kappa). Which one you choose largely depends on what type of data you have and how many raters are in your model.
Inter-Rater Reliability Methods
1. Percent Agreement for Two Raters
The basic measure for inter-rater reliability is a percent agreement between raters.

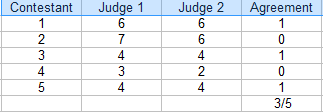
To find percent agreement for two raters, a table (like the one above) is helpful.
- Count the number of ratings in agreement. In the above table, that’s 3.
- Count the total number of ratings. For this example, that’s 5.
- Divide the total by the number in agreement to get a fraction: 3/5.
- Convert to a percentage: 3/5 = 60%.
The field you are working in will determine the acceptable agreement level. If it’s a sports competition, you might accept a 60% rater agreement to decide a winner. However, if you’re looking at data from cancer specialists deciding on a course of treatment, you’ll want a much higher agreement — above 90%. In general, above 75% is considered acceptable for most fields.
Percent Agreement for Multiple Raters
If you have multiple raters, calculate the percent agreement as follows:
Step 1: Make a table of your ratings. For this example, there are three judges:

Step 2: Add additional columns for the combinations(pairs) of judges. For this example, the three possible pairs are: J1/J2, J1/J3 and J2/J3.

Step 3: For each pair, put a “1” for agreement and “0” for agreement. For example, contestant 4, Judge 1/Judge 2 disagreed (0), Judge 1/Judge 3 disagreed (0) and Judge 2 / Judge 3 agreed (1).

Step 4: Add up the 1s and 0s in an Agreement column:

Step 5: Find the mean for the fractions in the Agreement column.
Mean = (3/3 + 0/3 + 3/3 + 1/3 + 1/3) / 5 = 0.53, or 53%.
The inter-rater reliability for this example is 54%.
Disadvantages
As you can probably tell, calculating percent agreements for more than a handful of raters can quickly become cumbersome. For example, if you had 6 judges, you would have 16 combinations of pairs to calculate for each contestant (use our combinations calculator to figure out how many pairs you would get for multiple judges).
A major flaw with this type of inter-rater reliability is that it doesn’t take chance agreement into account and overestimate the level of agreement. This is the main reason why percent agreement shouldn’t be used for academic work (i.e. dissertations or academic publications).
Alternative Methods
Several methods have been developed that are easier to compute (usually they are built into statistical software packages) and take chance into account:
- If you have one or two meaningful pairs, use Interclass correlation (equivalent to the Pearson Correlation Coefficient).
- If you have more than a couple of pairs, use Intraclass correlation. This is one of the most popular IRR methods and is used for two or more raters.
- Cohen’s Kappa: commonly used for categorical variables.
- Fleiss’ Kappa: similar to Cohen’s Kappa, suitable when you have a constant number of m raters randomly sampled from a population of raters, with a different sample of m coders rating each subject.
- Gwet’s AC2 Coefficient is calculated easily in Excel with the AgreeStat.com add on.
- Krippendorff’s Alpha is arguably the best measure of inter-rater reliability, but it’s computationally complex.
References
Beyer, W. H. CRC Standard Mathematical Tables, 31st ed. Boca Raton, FL: CRC Press, pp. 536 and 571, 2002.
Everitt, B. S.; Skrondal, A. (2010), The Cambridge Dictionary of Statistics, Cambridge University Press.
Klein, G. (2013). The Cartoon Introduction to Statistics. Hill & Wamg.
Vogt, W.P. (2005). Dictionary of Statistics & Methodology: A Nontechnical Guide for the Social Sciences. SAGE.