Types of Graph > Funnel Chart
Funnel Chart
Funnel charts can be used to illustrate stages in a process — usually sales processes. However, they could be used to show anything that’s decreasing in size. For example, you can use this type of chart to show:
- An order fulfillment process.
- A sales process from start to finish.
- Flow of information from top secret to unclassified.
- Knowledge areas from general knowledge to expert knowledge.
These charts are similar to pie charts, because the total area of the colored bars is 100%. For example, you might have:
- One bar with an area of 40%
- The next with 30%
- Then 22%
- Then 8%.
Essentially, a funnel chart is a differently-shaped pie chart.
A funnel chart usually shows an overall decrease at each stage. When the stages increase, it’s called a pyramid graph.
The top of the funnel is called the head. It’s also (somewhat confusingly) called the base. In this case, you can think of the “base” as being the base of a triangle (in geometry, the base of a triangle has nothing to do with which point is at the top of the paper). The lowest part of the chart is called the neck.
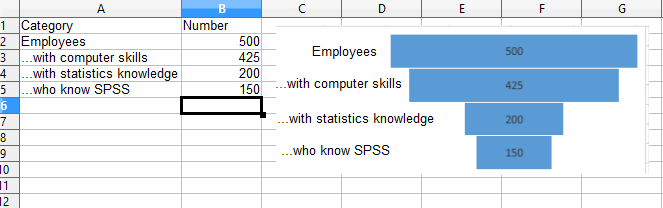
Funnel Chart in Excel 2016
To create a funnel chart in Excel 2016:
Step 1: Type your data into two columns. For example, type the categories into column A and the numbers into column B — as in the above image.
Step 2: Select all of the data.
Step 3: Click “Insert > Insert Waterfall or Stock Chart > Funnel.”
Funnel charts are only available in Excel 2016. Earlier versions of the software do not have this feature.
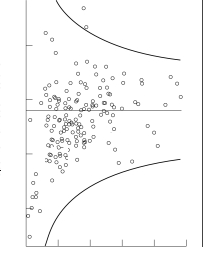
Funnel Chart vs. Funnel Plot
A funnel plot is not a synonym for funnel chart. A funnel plot is a scatter plot of the effect of a treatment vs. a measure of study precision or size. While funnel charts have bars showing stages, funnel plots have points for each data point. Essentially, the only thing they have in common is their overall shape.