Descriptive Statistics > Pyramid Graph
What is a Pyramid Graph?
A pyramid graph is a chart in the shape of a triangle or pyramid. These charts are best used when your data is organized in some kind of hierarchical way. The levels indicate some kind of progressive order, like:
- More “important” to least important. For example, CEOs and managers at the top and temporary workers on the bottom level.
- Older to newer. For example, great-great-grandparents at the top of the pyramid and great-great-grandchildren at the bottom.
- Specific to least specific. For example, expert fields at the top and more general fields at the bottom.
- Least to most: fewest items at the top and greatest at the bottom. For example, the USDA food pyramid shows that fats, oils and sweets (at the top, in the smallest piece) should be eaten less than other foods in larger sections below, like bread, cereal, rice and pasta (at the bottom, in the biggest piece).
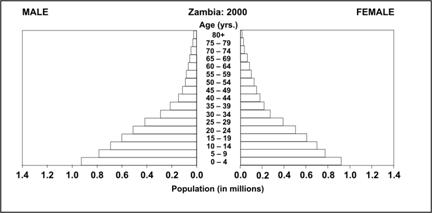
Population Pyramid
A population pyramid is a type of pyramid graph that shows the distribution of age groups for a particular country, area, or group. The graphs tends to be shaped like a pyramid because (perhaps, obviously), everyone is born at age 0. The top of the pyramid — usually around 90 to 100 years old — contains a tiny fraction of the population. These graphs are especially good for shows comparisons between age groups, like the following U.S. Census Bureau chart that shows the age range of males and females in Zambia:
The name Pyramid Graph is a little bit of a misnomer, because although it is a hierarchical-type graph, it isn’t always in the shape of a pyramid. For example, the following graph from the Census bureau resembles a house more than a pyramid:
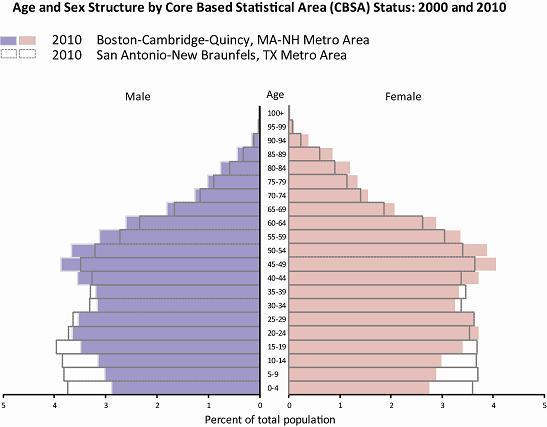
Each side of this pyramid graph shows data for one area (Boston-Cambridge-Quincy metro area and San Antonio-New Braunfels metro area).
References:
U.S. Census Bureau [Internet]. Washington, DCPatterns of Metropolitan and Micropolitan Population Change: 2000 to 2010. Retrieved September 9, 2016 from: http://www.census.gov/population/metro/data/pop_pyramid.html
U.S. Census Bureau [Internet]. Washington, DC: IDB Population Pyramids [cited 2004 Sep 10]. Available from: http://www.census.gov/ipc/www/idb/.