Homogeneity of Variance > Hartley’s Test / Fmax
What is The Fmax Test?
The Fmax test (also called Hartley’s Fmax) is a test for homogeneity of variance. In other words, the spread (variance) of your data should be similar across groups or levels. Compared to Levene’s test, Hartley’s test is fairly simple to figure out by hand.
An assumption of the Fmax test is that there are an equal number of participants in each group.
Steps
Example question: Run Hartley’s Fmax test for two conditions X and Y. Each condition (level) has 10 participants with variances of X = 12 and Y = 4.
Step 1: Find the variances for each group/level/condition. If you’re running an ANOVA test, the s2 values (i.e. the variances) will be shown in the output. Otherwise, you can calculate by hand (or use our variance and standard deviation calculator).
For this example, our variances are 12 and 4.
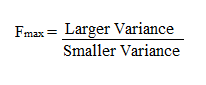
Step 2: Divide the larger variance by the smaller variance to find the Fmax ratio:
Note: If the ratio is close to 1, you can stop here, as your data shows homogeneity of variance.
In this example, we have 12/4 = 3. This ratio isn’t close to 1, so go to the next step.
Step 3: Look up the number of levels and the degrees of freedom (number of items in each level minus 1) in the Fmax table.
For 9 degrees of freedom (n – 1 = 10 – 1 = 9) and a k of 2 (k is the number of levels/groups), the table shows an Fmax value of 4.04.
Step 4: Compare your calculated value from Step 2 to the table value from Step 3.
- If your calculated value from Step 2 is smaller than the table value, the variance is homogeneous.
- If your calculated value from Step 2 is larger than the table value, the variance is not homogeneous.
Our calculated value of 3 is smaller than the table value of 4.04, so our variance is homogeneous.
Hartley’s Fmax Table
Degrees of freedom: Subtract 1 from your sample size to find the degrees of freedom. For example, if you have 10 items in your sample, then df = 10 – 1 = 9.
k: is the number of levels/groups or conditions.
| DF |
K (Number of levels/groups/treatments) |
||||||||||
| 2 | 3 | 4 | 5 | 6 | 7 | 8 | 9 | 10 | 11 | 12 | |
| 2 | 39.0 | 87.5 | 142 | 202 | 266 | 333 | 403 | 475 | 550 | 626 | 704 |
| 3 | 15.4 | 27.8 | 39.2 | 50.7 | 62.0 | 72.9 | 83.5 | 93.9 | 104 | 114 | 124 |
| 4 | 9.6 | 15.5 | 20.6 | 25.2 | 29.5 | 33.6 | 37.5 | 41.1 | 44.6 | 48.0 | 51.4 |
| 5 | 7.2 | 10.8 | 13.7 | 16.3 | 18.7 | 20.8 | 22.9 | 24.7 | 26.5 | 28.2 | 29.9 |
| 6 | 5.82 | 8.38 | 10.4 | 12.1 | 13.7 | 15.0 | 16.3 | 17.5 | 18.6 | 19.7 | 20.7 |
| 7 | 4.99 | 6.94 | 8.44 | 9.70 | 10.8 | 11.8 | 12.7 | 13.5 | 14.3 | 15.1 | 15.8 |
| 8 | 4.43 | 6.00 | 7.18 | 8.12 | 9.03 | 9.78 | 10.5 | 11.1 | 11.7 | 12.2 | 12.7 |
| 9 | 4.03 | 5.34 | 6.31 | 7.11 | 7.80 | 8.41 | 8.95 | 9.45 | 9.91 | 10.3 | 10.7 |
| 10 | 3.72 | 4.85 | 5.67 | 6.34 | 6.92 | 7.42 | 7.87 | 8.28 | 8.66 | 9.01 | 9.34 |
| 12 | 3.28 | 4.16 | 4.75 | 5.30 | 5.72 | 6.09 | 6.42 | 6.72 | 7.00 | 7.25 | 7.43 |
| 15 | 2.86 | 3.54 | 4.01 | 4.37 | 4.68 | 4.95 | 5.19 | 5.40 | 5.59 | 5.77 | 5.95 |
| 20 | 2.46 | 2.95 | 3.29 | 3.54 | 3.76 | 3.94 | 4.10 | 4.24 | 4.37 | 4.49 | 4.59 |
| 30 | 2.07 | 2.40 | 2.61 | 2.78 | 2.91 | 3.02 | 3.12 | 3.21 | 3.29 | 3.36 | 3.39 |
| 60 | 1.67 | 1.85 | 1.96 | 2.04 | 2.11 | 2.17 | 2.22 | 2.26 | 2.30 | 2.33 | 2.36 |