First derivative just means taking the derivative (a.k.a. finding the slope of the tangent line) once. It’s usually just shortened to “derivative.”
First Derivative Test
The first derivative test is one way to study increasing and decreasing properties of functions. The test helps you to:
- Find the intervals where a function is decreasing or increasing.
- Identify local minima and local maxima.
- Sketch a graph without the aid of a graphing calculator (although you can also use “rise over run” to sketch the graph of a derivative).
It’s useful to think of the derivative here as just the slope of the graph. Technically, it’s the slope of the tangent line at a certain point, but simplifying the concept to just increasing or decreasing slopes helps with this particular test.

Your result from the first derivative test tells you one of three things about a continuous function:
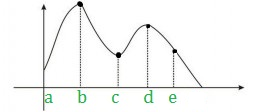
- If the first derivative (i.e. the slope) changes from positive to negative at a certain point (going from left to right on the number line), then the function has a local maximum at that point. Points b and d on the above graph are examples of a local maximum.
- If the first derivative changes from negative to positive (going from left to right on the number line), then the function has a local minimum at that point. Point c on the graph is a local minimum.
- If the first derivative doesn’t change sign at the critical number (going from left to right on the number line), then there is neither a local maximum or a local minimum at that critical number. Point e is one example where the slope does not change sign.
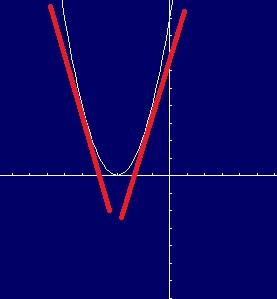
Sample question: Use the first derivative test to find the local maximum and/or minimum for the graph x2 + 6x + 9 on the interval -5 to -1.

Step 1: Find the critical numbers for the function. (Click here if you don’t know how to find critical numbers).
- Taking the derivative: f’= 2x + 6
- Setting the derivative to zero: 0 = 2x + 6
- Using algebra to solve: -6 = 2x then -6/2 = x, giving us x = -3
There is one critical number for this particular function, at x = -3.
Step 2: Choose two values close to the left and right of the critical number. The critical number in this example is x =-3, so we can check x = -2.99 and x = 3.01 (these are arbitrary, but pretty close to -3; you could try -2.999999 and -3.0000001 if you prefer).
Step 3: Insert the values you chose in Step 2, into the derivative formula you found while figuring out the critical numbers in Step 1:
For x = -3.01:
f’ = 2(-3.01) + 6 = -0.02→ a negative slope
For x = -2.99
f’= 2(-2.99) + 6 = 0.02→ a positive slope
Step 4: Compare your answers to the three first derivative test rules (stated in the intro above). The derivative changes from negative to positive around x = -3, so there is a local minimum.
That’s it!
Tip: To check that you found the correct critical numbers, graph your equation. As the graph above clearly shows—you should only find one critical number for this particular equation, at x = -3.
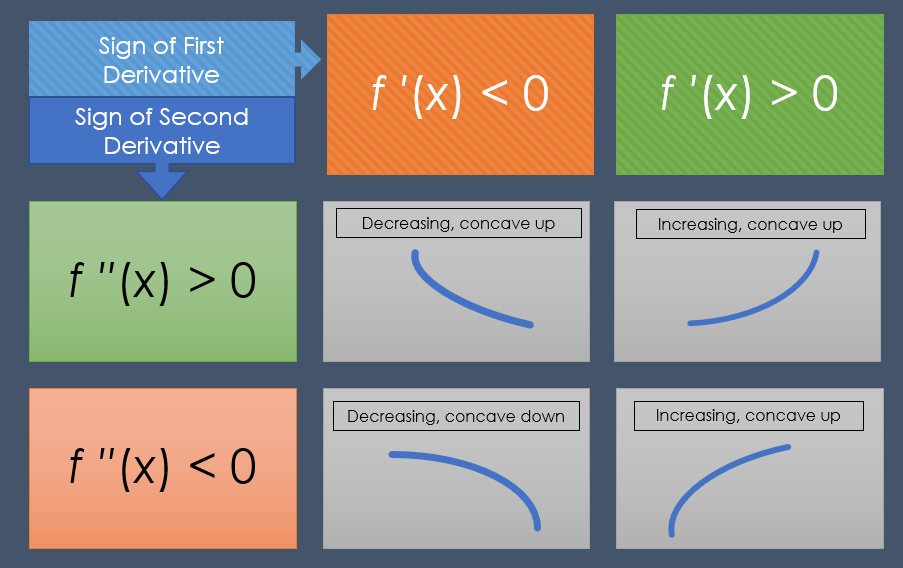
The following table summarizes the application of the first derivative test (f’) and the second derivative test (f”) for drawing graphs.

Back to Top.