Statistics Definitions > Data Mining
Contents:
What is Data Mining?
Steps in Data Mining
Data sets in Data Mining.
What is Data Mining?
Data mining, or knowledge discovery from data (KDD), is the process of uncovering trends, common themes or patterns in “big data”. Uncovering patterns in data isn’t anything new — it’s been around for decades, in various guises. The term “Data Mining” appeared in academic journals as early as 1970 (e.g. Jorgenson et. al, 1970). But it only really migrated into popular use in the 1990s, after the advent of the internet.
Knowledge from data mining can help companies and governments cut costs or increase revenue. For example, an early form of data mining was used by companies to analyze huge amounts of scanner data from supermarkets. This analysis revealed when people were most likely to shop, and when they were most likely to buy certain products, like wine or baby products. This enabled the retailer to maximize revenue by ensuring they always had enough product at the right time in the right place. One of the first best selling systems was A.C. Nielson’s best-selling Spotlight, which broke down supermarket sales data into multiple dimensions including volume by region and product type (Piatesky-Shapiro et. al, 1996).
As well as gathering data on “What people watch, listen to, or buy” (Nielson’s tagline), modern mining techniques are used to find answers to a wide variety of questions such as:
- Which transactions are more likely to be fraudulent?
- Who is a “typical” customer?
- What mammograms should be flagged as “abnormal”?
Although commonly used in large businesses and organizations, any kind of data can be mined, from any type of database.
Who uses Data Mining?
Data mining is primarily used by industries that cater to the consumer, like retail, financial and marketing companies. If you’ve ever shopped at a retail store and received customized coupons, that’s a result of mining. Your individual purchase history was analyzed to find out what products you’ve been buying and what promotions you’re likely to be interested in. Netflix uses data mining to recommend movies to its customers, Google uses mining to tailor advertisements to internet users and Walmart uses data mining to manage inventory and identify areas where new products are likely to be successful. Mining is more likely to be used by larger companies, as enormous computers are required to sift through data.
Steps in Data Mining
Mining consists of three major steps:
- Explore the data to uncover themes and trends. This stage may include some fairly complex analysis using a wide variety of statistical methods.
- Build models to explain the data and identify patterns with validation and verification. Multiple models are considered during this step.
- Apply the model to new data to predict outcomes.
1. Uncovering themes and trends
The first step in exploring your data is data cleaning: dealing with missing values and noisy data. You’ve got several options for missing values, from the simple (replace the missing values with zeros) to the complex (e.g. multiple imputation). For many more options, see: Options for Missing Data. For noisy data, Lowess Smoothing is a good option.
Next, you’ll want to reduce your data to manageable levels. Exactly how you do this depends on what type of data you have and what your goals are. A few suggestions:
- Principal Components Analysis: reduces your data to manageable levels. PCA is a good tool to use if you suspect you have redundancy (correlations as opposed to duplicate items) in your data set.
- Make a Histogram: If you have a very large set of data, a histogram can reduce your data to a simple set of bins; Bins work like sorting bins in real life — imagine physically sorting the data into a set of 20 bins. The end result? You can see how full (or empty) each bin is. This works well if you’ve got a clear way to slice your data up into sections (like income levels, or credit scores).
- Sample your data: With sampling, you take small pieces of your data and use those small sections to make inferences about the entire data set. Sampling is an especially good tool if you have a massive amount of data (e.g. millions if items) and you want to reduce that amount to a workable level (e.g. a couple of hundred).

2. Building models to explain the data
For class-labeled data sets, classification and regression are used to build models (class-labeled data has a set of discrete attributes that you want to predict).
Classification is the model building process for discrete data. The goal is to find a model or function, or set of models/functions, that adequately describes the concepts or data classes you’re interested in. Different ways of model representation (Han et. al, 2011) include:
- Classification rules (e.g. IF-THEN rules),
- Decision trees: a very specific type of probability tree that enables you to make a decision about some kind of process. For example, you might want to choose between manufacturing item A or item B, or investing in choice 1, choice 2, or choice 3.
- Mathematical formulas (e.g. a set of functions).
For continuous data, regression analysis can be useful to predict trends — past and present. Data is fitted to an equation (linear, quadratic, or some other form). The equation can then be used to fill in the blanks.
3. Applying the Model to Make New Predictions
Finding the right model is great, but unless you actually use that model to do something then it’s as useful as a dusty old textbook. You have to take your model and actually use it to answer the questions you mined the data in the first place for. How exactly you do this depends on what you ended up with (a linear model, for example, or perhaps a function). However, overall success is measured when you make sense of that predicted data.
Data Sets in Data Mining
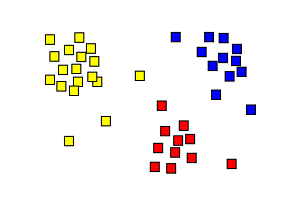
Data sets are collections of data. Any set of items can be considered a data set. For example {1,2,3} is a data set consisting of three items. On the opposite end of the scale, sets can contain millions of items, like the data from the US Census. Each single value in a data set (like 1, 2 or 3 in the above set) is called a datum.
Data doesn’t have to be obviously connected in order to call it a “set.” Any group of items can be thought of as a data set. For example, a random set of items like {blue,7,eyes,repair} can be considered a set. The fact that the items are placed together makes it a set. This fact comes in particular use for Data Mining, where large sets of data are sifted through to try and find trends and themes in the data. Those trends and themes are usually not obvious to the naked eye. As a simple example, that seemingly random collection {8%,7,primary,repair}? Those are actually related to the color blue. Eight percent of people have blue eyes, blue is the 7th color in the rainbow song, blue is a primary color, and blue is often used on machinery to indicate it needs repairing.
More Specific Types
When people talk about data sets, they’re usually talking about the general idea of a data set, as outlined above. However, there are specific types of data sets used in statistics, such as:
- Matrices, where columns represent variables and rows are members of the set.
- A database table, which contains a single data set.
Public Data Sets
Classic
Several data sets have been used over and over again in statistics, including:
- Bayesian Data Analysis: author Andrew Gelman, provides the large data sets referenced in the classic book.
- Iris, famous in pattern recognition papers.
- Chatfield’s Time Series provides four data sets from the book on time-series forecasting.
Other Public Sets
Many governments, companies and institutions provide free public access to large sets of data for data mining.
- Githib lists a plethora of public data, from government to museums, biology to physics, finance to climate and weather.
- Amazon.com hosts a range of public data sets that you can access for free. Sets include earth science from NASA, web crawl data, and US Census data from 1980 to 2000.
- The United Kingdom government provides access to thousands of data sets. They include: road safety data, road traffic data and hundreds of other categories.
References:
Han, J. Pei, J. Kamber, M. (2011). Data Mining: Concepts and Techniques. Elsevier.
Linoff et. al. (2011). Data Mining Techniques: For Marketing, Sales, and Customer Relationship Management. Wiley and Sons.
Jorgenson, D. Hunter, J. Nadiri, M. (1970). The Predictive Performance of Econometric Models of Quarterly Investment Behavior. Econometrica. Vol. 38, No. 2 (Mar., 1970), pp. 213-224
Piatesky-Shapiro et. al. (1996). An overview of issues in developing industrial data mining and knowledge discovery applications. From KDD-96 Proceedings. Retrieved October 3, 2017 from: http://citeseerx.ist.psu.edu/viewdoc/download?doi=10.1.1.324.3889&rep=rep1&type=pdf