What is a Categorical Distribution?
Dive into the world of categorical distribution, a concept with dual meanings! While casually speaking, it refers to any distribution with categories, on a deeper dive, it’s a fascinating extension of the Bernoulli distribution for categorical random variables. Unlike the Bernoulli’s binary outcome, categorical random variables offer a plethora of possibilities!
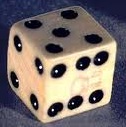
Dive into the world of probability! Did you know that a Bernoulli distribution has only two possible outcomes, 0 or 1? On the other hand, a categorical distribution deals with multiple outcomes, like rolling a dice with its six possible results. Also, if you ever find yourself in a situation with just one trial, a categorical distribution can turn into a multinomial distribution. Because these distributions only focus on specific outcomes, they’re often referred to as discrete categorical distributions.
Examples
 Imagine tossing a six-sided dice into the air and watching as it tumbles gracefully before landing fifty times. The dice dances with the numbers 1 to 6, each with a 1/6 chance of being the outcome.
Search for words that appear throughout a text. The probabilities of each word emerging depend on the total number of words in the text.
Witness the thrill of a hockey match, attentively assessing a player’s goal-scoring potential. Acknowledge the vast spectrum of possible outcomes influenced by game duration, player positioning, and skill. Revel in the excitement of anticipating the crucial moment when the puck defies expectation and finds the net. This is an example of a categorical distribution.
References:
A Dictionary of Statistical Terms, 5th edition, prepared for the International Statistical Institute by F.H.C. Marriott. Published for the International Statistical Institute by Longman Scientific and Technical.
Leitch, M. (201). A Pocket Guide to Risk Mathematics: Key Concepts Every Auditor Should Know. John Wiley & Sons.