< Probability Distribution List < Bipolar Distribution
A bipolar distribution is a specific type of bimodal distribution that has two distinct peaks offering contradictory information.
Statisticians almost universally use “bimodal distribution” to denote a two-peaked distribution (regardless of the gap in the middle). “Bipolar distribution” is more a domain-specific or informal term in surveys (love-it-or-hate-it data), a geographical term in biology (species at both poles), or a directional-statistics term (Watson’s bipolar distribution).
Bimodal vs. Bipolar Distribution
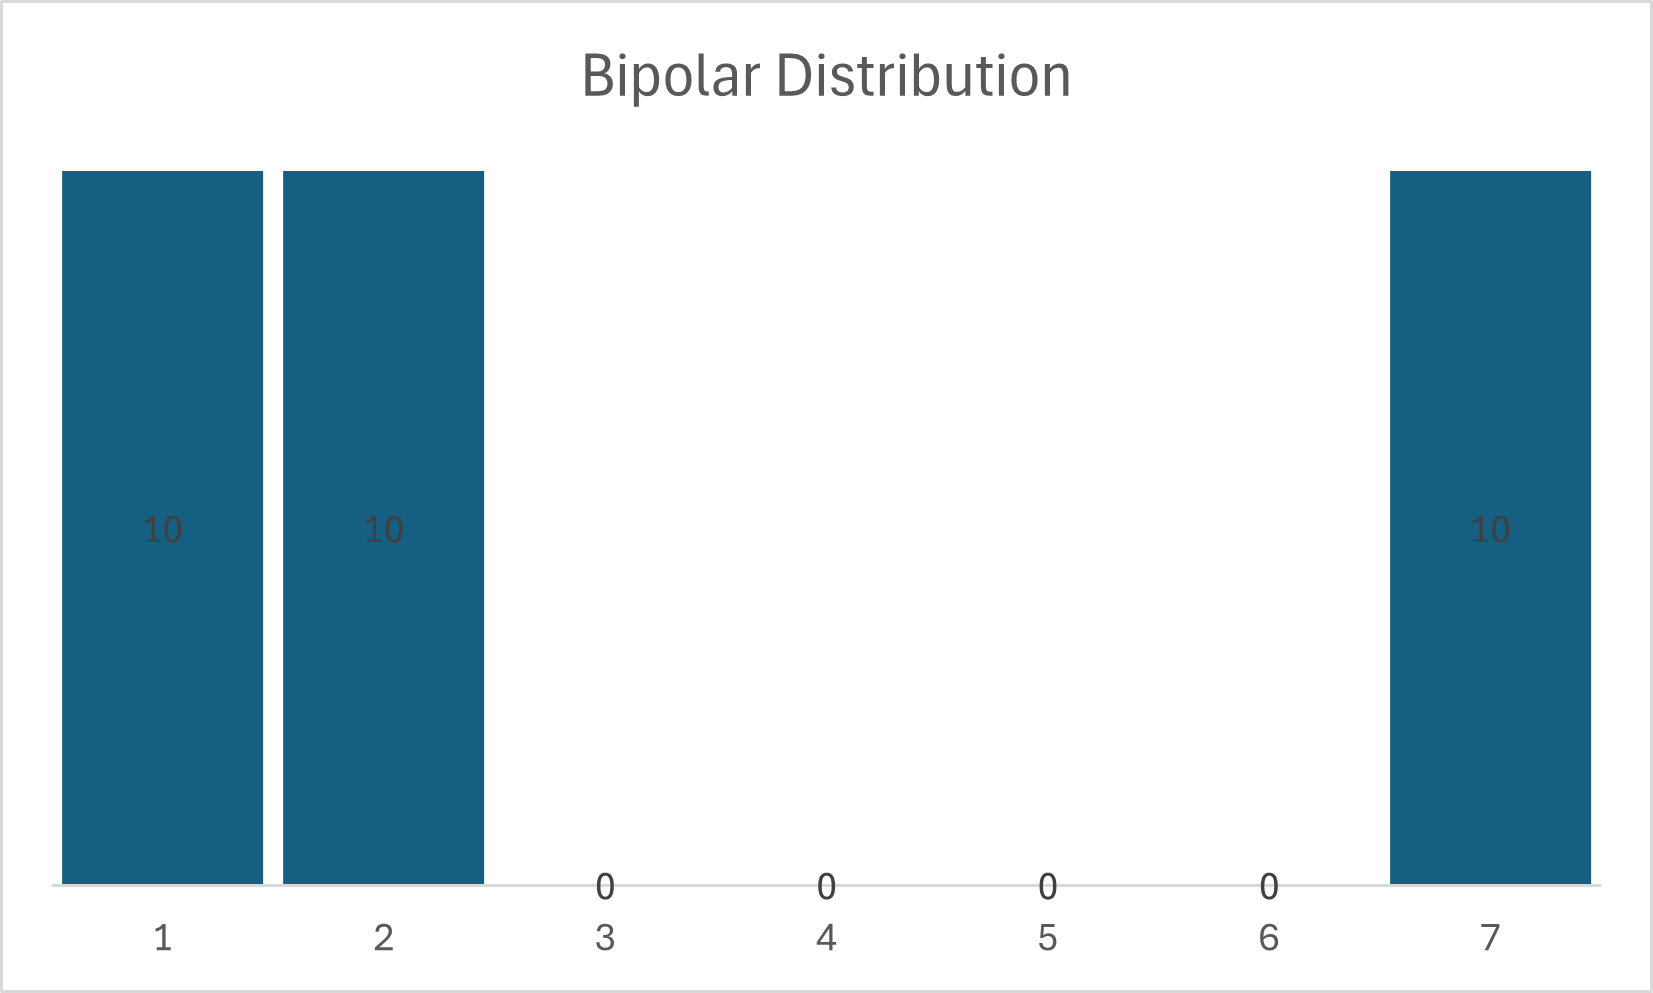
The following image shows a bipolar distribution of ratings where people rate customer service on a scale from 1 to 7. From the lows and highs, you can assume that people either love it, or hate it. As such, it offers a wealth of contradictory information; while we know everyone hated or loved the service, we cannot make any determination at all about the quality of the service.
This distribution can also be described as an extreme U-shaped distribution [1].
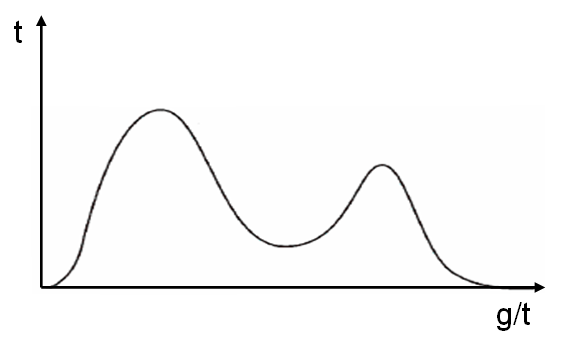
In contrast, a bimodal distribution is a distribution with two distinct peaks or modes. The modes can be anywhere on the distribution. The distribution may or may not have a range of values in between the two peaks.
In summary:
- Bimodal distribution: Two peaks. May contain connecting values between the peaks. Standard statistical term for any distribution with two peaks.
- Bipolar distribution: Two peaks with no connecting values in between. An informal term used to indicate a distribution with two sets of values that are opposite in nature.
Bipolar distribution in biology
In biology, a “bipolar distribution” refers to the presence of species in the Northern and Southern hemispheres. For example, species of marine bacteria are found exclusively at both poles and nowhere else [2]. Many marine species such as anchovies, saury, and gray dolphin are found near the poles but are absent in the tropics [3].
Watson bipolar distribution
The Watson bipolar distribution (or simply the Watson distribution) is a single-direction distribution used in directional data analysis, where bipolar or girdle distribution are required [4]; Girdle distributions are measurement bands on the stereographic projection, scattered on the sides of a great circle [5].
References
- Klein, Ingo, 2017. “(Generalized) maximum cumulative direct, paired, and residual Φ entropy principle,” FAU Discussion Papers in Economics 25/2017, Friedrich-Alexander University Erlangen-Nuremberg, Institute for Economics
- Sul et al. January 16, 2013. Marine bacteria exhibit a bipolar distribution. Retrieved April 22, 2023 from: https://www.pnas.org/doi/10.1073/pnas.1212424110
- Sverdrup, H. (1942). The Oceans Their Physics, Chemistry, and General Biology. XVIIAnimals in Relation to Physical-Chemical Properties of the Environment. Prentice-Hall.
- Mardia, K. V., & Dryden, I. L. (1999). The Complex Watson Distribution and Shape Analysis. Journal of the Royal Statistical Society. Series B (Statistical Methodology), 61(4), 913–926. http://www.jstor.org/stable/2680713
- Waldron, J. (2020). Data in Structural Geology. https://courses.eas.ualberta.ca/eas421/lecturepages/orientation.html