Calculus Problem Solving > Area of a Bounded Region
What is a Bounded Region?
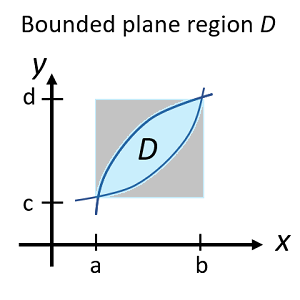
Area of Bounded Region: Worked Example
In integral calculus, if you’re asked to find the area of a bounded region, you’re usually given a set of functions to work with.
Example question: Find the area of a bounded region defined by the following three functions:
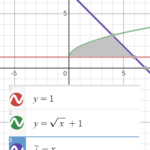
- y = 1,
- y = √ (x) + 1,
- y = 7 – x.
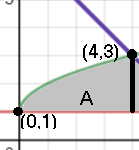
Step 1: Draw the bounded area. I used Desmos.com’s graphing calculator to get an idea of the shape bounded by the three functions:
Step 2: Chop the shape into pieces you can integrate (with respect to x). This is probably the trickiest part of these types of questions.
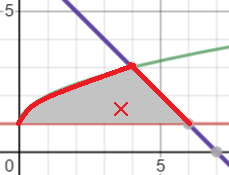
In general, look for regular shapes (triangles, rectangles, squares) or as close to regular shapes as you can get (like the “curvy” triangle A). They should have bases that follows a line horizontal to the x-axis; These shapes are easier to integrate. Caution: Sometimes it’s actually easier to divide the shape up horizontally, instead of the vertical slice shown above. Refer to this pdf (from MIT) for an example of when you would want to slice horizontally.
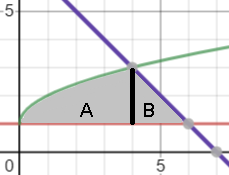
Step 3: Find the bounds of integration (i.e. the two numbers on the x-axis you’ll be integrating between) for one of the shapes. Let’s start with shape A.
The left-hand bound is easy to see from the graph (x = 0); The right-hand side is x = 4; You can find it with the intersection feature of a graphing calculator or with algebra (See: How to find the intersection of two lines).
Step 4: Set up the integral, with the bounds you found in Step 3:
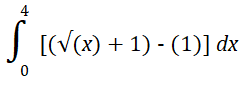
If you’re wondering why I subtracted 1 in the integral, take a look at the following image:
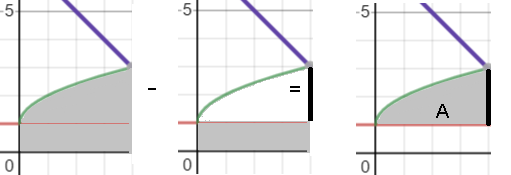
Solving the integral (using the power functions rule and the fact that the integral of a constant function is equal to c x. For example, the integral of f(x) = 10 is 10x). We get an area of 16/3.
Step 5: Repeat steps 3 and 4 for the remaining shapes. For this example we only have one remaining shape (with integral bounds of 4 to 6). Integrating area B, we get 2.
Step 6: Add the areas of all the shapes together.
Area A (16/3) + Area B (2/1) = 22/3.
References
MIT: Find the area between x = y2 and y = x – 2. Retrieved September 20, 2020 from: https://ocw.mit.edu/courses/mathematics/18-01sc-single-variable-calculus-fall-2010/unit-3-the-definite-integral-and-its-applications/part-b-second-fundamental-theorem-areas-volumes/session-56-geometric-interpretation-of-definite-integrals/MIT18_01SCF10_Ses56b.pdf