Types of Variable > Quantitative Variables
Contents:
1. Definition
Two types of variables are used in statistics: Quantitative (also called measurement variable or numerical variables) and categorical (also called qualitative):
- Quantitative variables or numeric variables are numbers such as counts or percents.
- Categorical variables are descriptions of groups or things, such as “breeds of dog” or “voting preference”.
Examples of Quantitative Variables / Numeric Variables:
- High school Grade Point Average (e.g., 4.0, 3.2, 2.1).
- Number of pets owned (e.g., 1, 2, 4).
- Bank account balance (e.g., $100, $987, $-42.
- Number of stars in a galaxy (e.g., 100, 2301, 1 trillion) .
- Average number of lottery tickets sold (e.g., 25, 2,789, 2 million).
- How many cousins you have (e.g., 0, 12, 22).
- The amount in your paycheck (e.g., $200, $1,457, $2,222).
General rule of thumb: if you can add it, it’s quantitative. For example, a G.P.A. of 3.3 and a G.P.A. of 4.0 can be added together (3.3 + 4.0 = 7.3), so that means it’s quantitative. On the other hand, grades of A, B, or C can’t be added together unless you convert them to numbers, so A, B, and C, are not quantitative.
Examples of Categorical Variables:
- Class in college (e.g., freshman, sophomore, junior, senior).
- Party affiliation (e.g., Republican, Democrat, Independent).
- Type of pet owned (e.g., dog, cat, rodent, fish).
- Favorite author (e.g., Stephen King, James Patterson, Charles Dickens).
- Preferred airline (e.g., Southwest, Virgin, Quantas).
- Hair color (e.g., blond, brunette, black).
- Your race (e.g., Asian, Latino, black).
- Types of hats (e.g., sombrero, beanie, fedora).
As a general rule, if you can’t add something, then it’s categorical. For example, you can’t add cat + dog, or Republican + Democrat.
Categorical vs. Quantitative
What is a Quantitative Data Condition?
When you graph or plot statistical data, make sure you have quantitative data of known units. If you don’t have known units, then you won’t be able to graph it. For example, the first list above states that “G.P.A.” is quantitative data. However, you won’t be able to graph G.P.A. versus another variable (say, race or sex) unless you actually have a unit, like 3.1 or 2.9. This sounds obvious, but with more complex data you should always check the quantitative data condition for missing or nonsensical information before you start a graph.
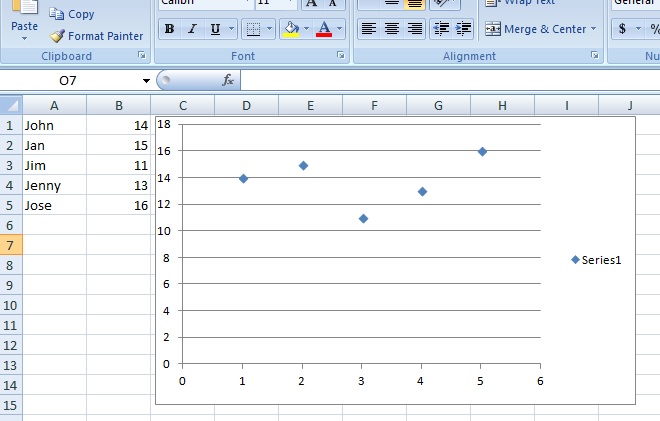
Histograms, boxplots and scatter plots all require that you have quantitative (numerical data). If you try to graph categorical data with a histogram, boxplot or scatter plot, you’ll run into the same type of problem as if you try to graph numerical data with pie charts: your graphs won’t make any sense. The following scatter plot illustrates this point. I made a scatter plot in Microsoft Excel of categorical data (names) along with their ages in Excel. Excel didn’t recognize the categorical data and assigned numbers instead. The scatter plot is meaningless; no one will know that “1”, “2”, “3”, “4” and “5” refer to names and even if they do…the graph will be a mess if you have 100 names!:
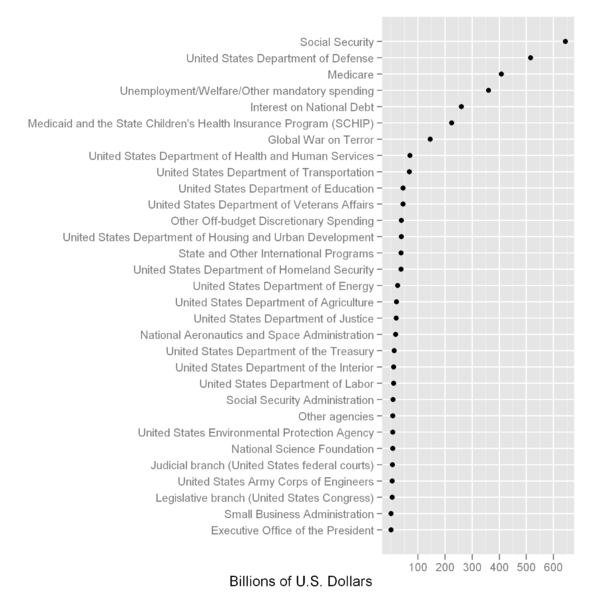
A workaround to this problem could be to assign numbers to names (e.g. John = 1, Jan = 2…), and include a key on the graph. However in this particular example, a scatter plot really isn’t the best choice for a graph— choose the bar graph instead. A bar graph allows you to plot categories on one axis, so the quantitative data condition doesn’t have to be met for one axis.
Check out our YouTube channel for more help and tips.
References
Beyer, W. H. CRC Standard Mathematical Tables, 31st ed. Boca Raton, FL: CRC Press, pp. 536 and 571, 2002.
Agresti A. (1990) Categorical Data Analysis. John Wiley and Sons, New York.
Kotz, S.; et al., eds. (2006), Encyclopedia of Statistical Sciences, Wiley.
Lindstrom, D. (2010). Schaum’s Easy Outline of Statistics, Second Edition (Schaum’s Easy Outlines) 2nd Edition. McGraw-Hill Education