Descriptive Statistics: Charts and Graphs >
The X-MR Chart (X-Moving Range Chart) is a control chart used in process monitoring. While the X-only chart plots processes with individual observations, the X-MR plots a combination of individual measurements and a moving range based on two consecutive measurements.
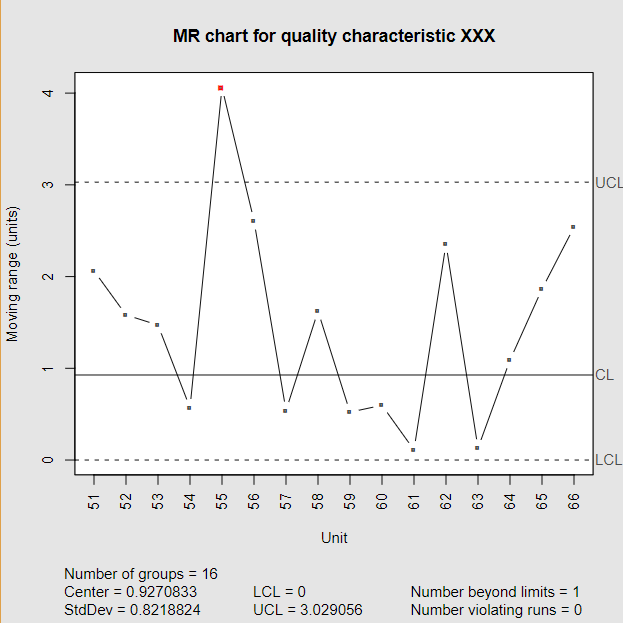
Thus, the X-Moving range chart is a pair of charts: one chart with individual observations and one chart displaying the moving range — the difference from one point to the next.
The moving range is defined as [1]:
MRi = |xi -xi-1|.
When to use an X-MR chart
X-MR charts are usually used for processes that do not work continuously or that generate a sparse number of items. However, sometimes X-MR charts are not necessary; the simple X-only chart (i.e., without the movement) is recommended for detecting changes process means, process standard deviations, or both at the same time [2].
You should choose the X-MR chart only when more sensitive charting techniques are impossible. For example, if you only have a single measurement (n = 1), it’s impossible to determine the range of variation [3].
References
MR Chart: DanielPenfield,
[1] NIST. Individuals Control Charts. Retrieved June 4, 2022 from: https://www.itl.nist.gov/div898/handbook/pmc/section3/pmc322.htm
[2] Rahardja, D. (2014). Comparison of Individual and Moving Range Chart Combinations to Individual Charts in Terms of ARL after Designing for a Common “All OK” ARL. Journal of Modern Applied Statistical Methods. November, Vol. 13, No. 2, 364-378.
[3] Stamatis, D. (2002). Six Sigma and Beyond. Statistical Process Control, Volume IV. Taylor and Francis.