Statistics Definitions > STEN Score
You may find it helpful to read this article first: What is a Bell Curve?
What is a STEN score?
STEN scores (or “Standard Tens”) divide a scale into ten units. In simple terms, you can think of them as “scores out of ten”:
- A STEN of 1 or 2 is far below average,
- A STEN of 5-7 is average,
- A STEN of 9 or 10 is far above average.
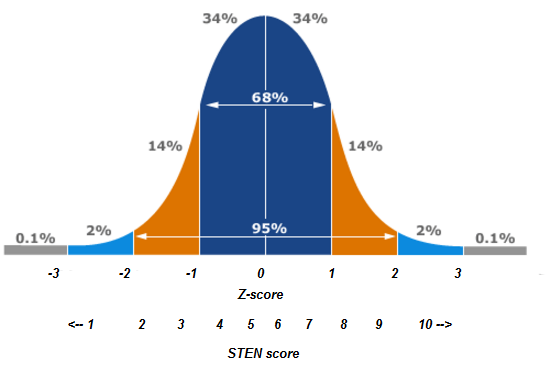
STEN scores and Bell Curves
However, STEN scores don’t break up scores into 10 even chunks of 10%. They are based on the bell curve, so the vast majority of people will fall into the “average” range. Very few people (about 2%) will get either the lowest score of 1 or the highest score of 10. The average STEN score is 5.5:
Converting Z-Scores to STEN
You may find it helpful to read this article first: What is a Z-Score?
Z-scores are commonly used in statistics as a measure of spread. One z-score is equal to one standard deviation (either above or below the mean). To convert a z-score to a STEN score, just multiply the z-score by the standard deviation and add the mean. As a formula, that’s:
STEN = z(SD)+M
For example, if you wanted to convert a z-score of 2 to a STEN Score:
STEN = 2(2) + 5.5 = 9.5.
STEN scores are always rounded up, so a score of 9.5 would be rounded to 10.
Types of Tests
Many personality tests and questionnaires use STEN scores. For example, the Sixteen Personality Factor Questionnaire is a measure of normal range personality.
STEN scores sometimes have fairly specific meanings attached to them. For example, a low STEN on the Adult-Adolescent Parenting Inventory can indicate a high probability of engaging in abusive behavior, while a low STEN on a standardized educational test can indicate a need for placement into special education.
References
Neukrug, E. & Fawcett, S. (2019). Essentials of Testing and Assessment: A Practical Guide for Counselors, Social Workers, and Psychologists, Enhanced. Cengage Learning.